26 African markets under review
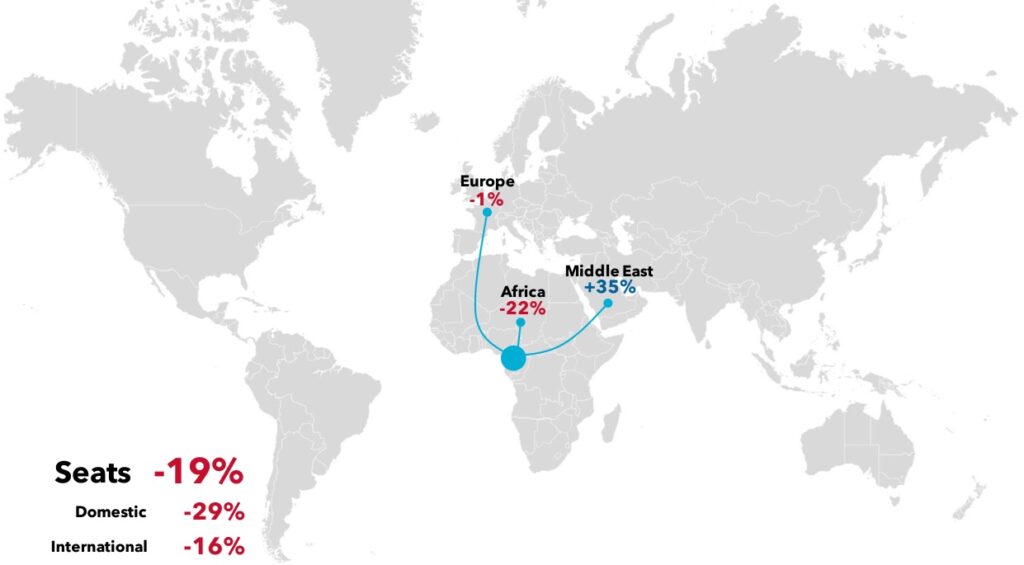
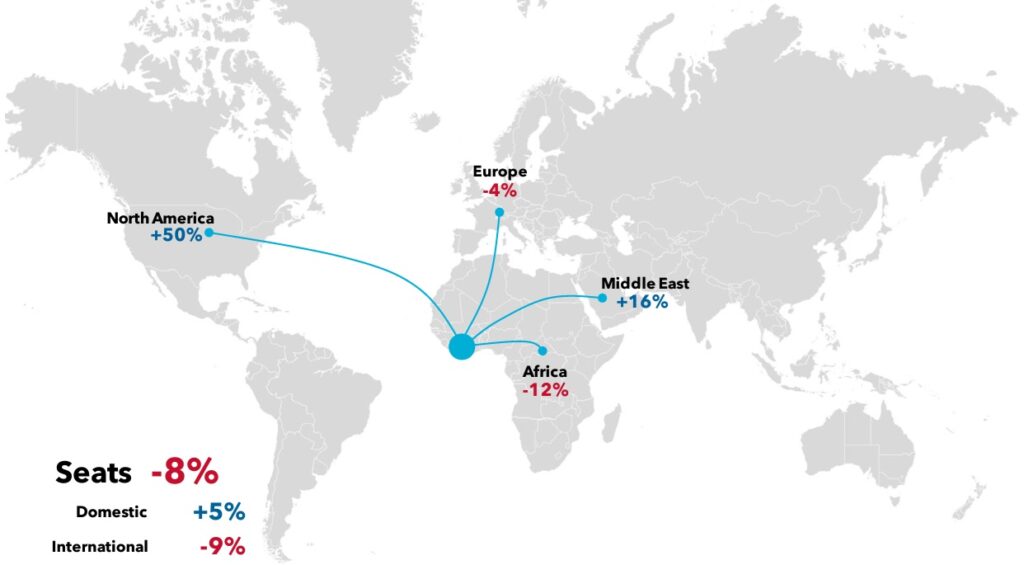
The state of airline capacity and average ticket prices (ATPs) has been reviewed for 26 markets across Africa, which have been outlined in the map (see PDF).
The recovery in seat capacity has been established using data from OAG (the Official Airlines Guide) for January 2019 and 2024. This means capacity can therefore be compared to its pre-pandemic (2019) level.
The development of airfares during 2023 has been based on BCD transactional data, which covers the first nine months of the year. The outlook for airfares relies on forecasts from IATA (International Air Transport Association), which produces its figures using a US dollar-based index. This means the numbers may include some exchange rate effects, arising from the conversion of ticket prices from local currency to dollars.
There are no simple messages to be taken from the analysis, other than that the situation in Africa is complex. The recovery in each country has been subject to differences in prevailing local conditions. While some markets have emerged as tourism hotspots, others have found themselves embroiled in civil conflict. Each market needs to be considered on its own merits.
Algeria
Recovery in airline capacity
Summary
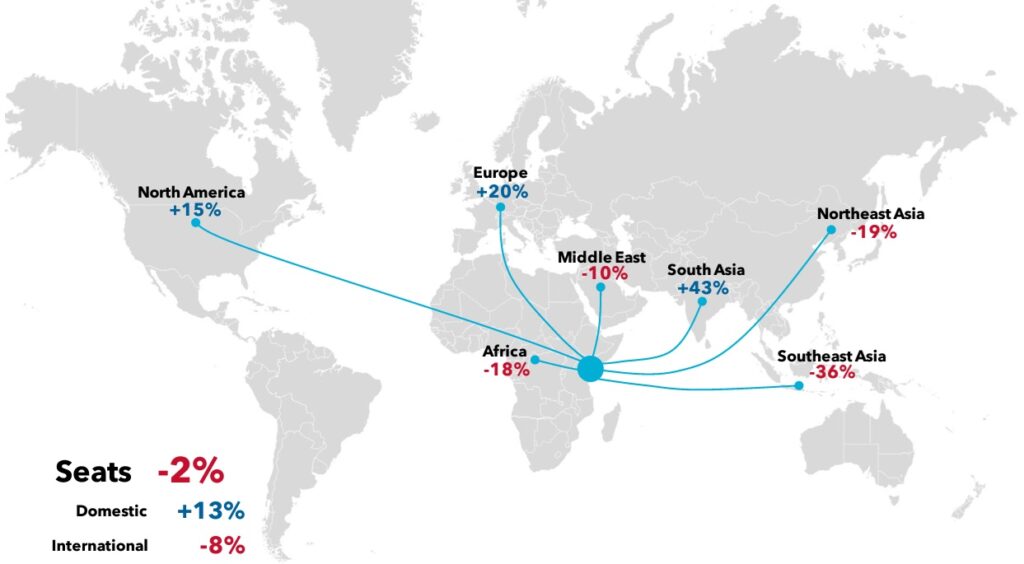
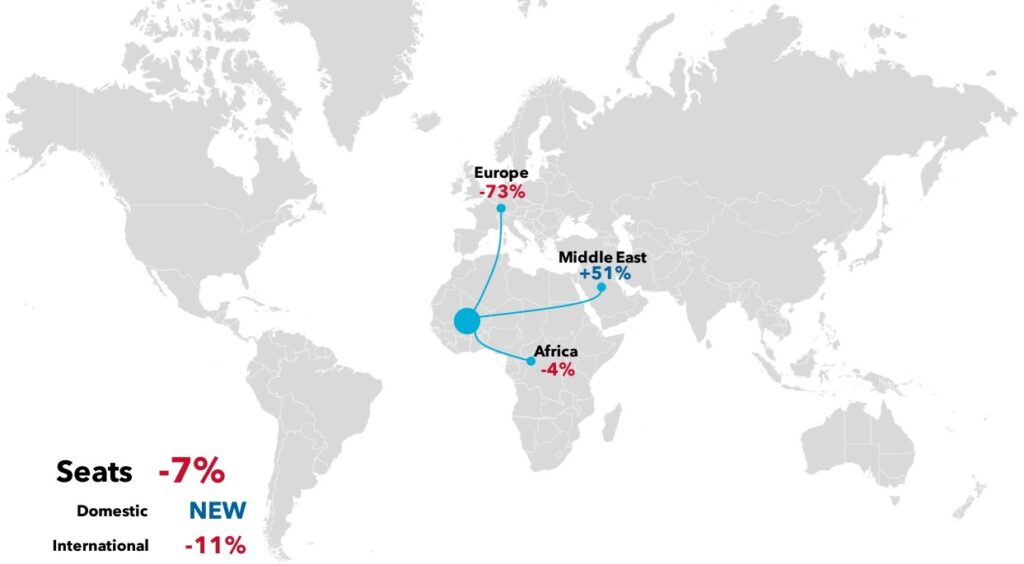
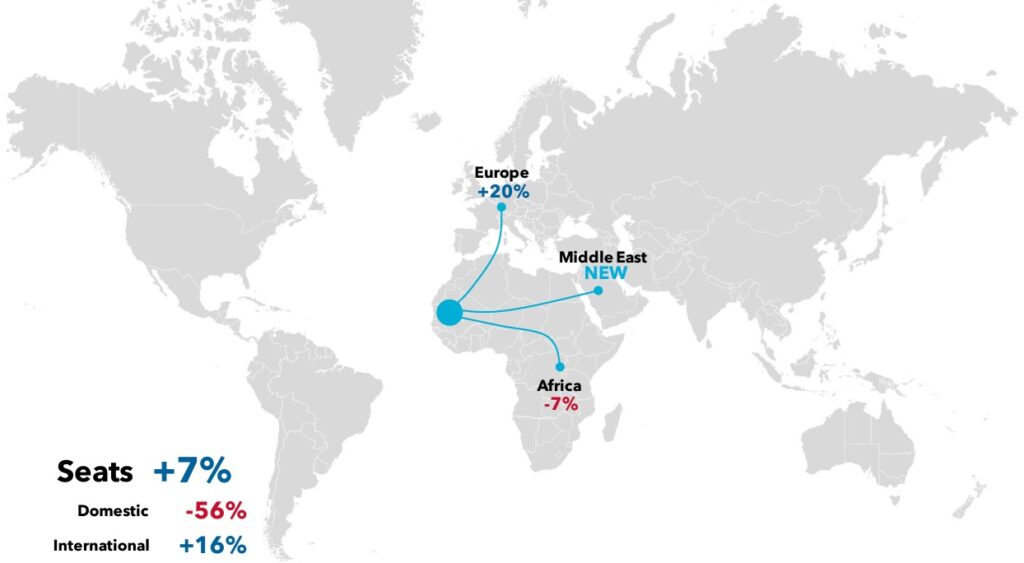
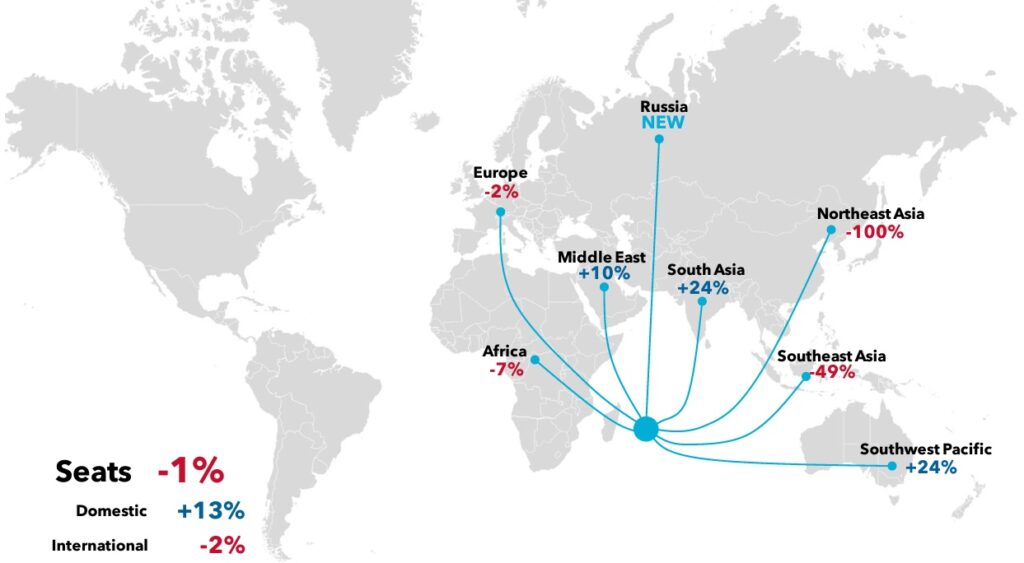
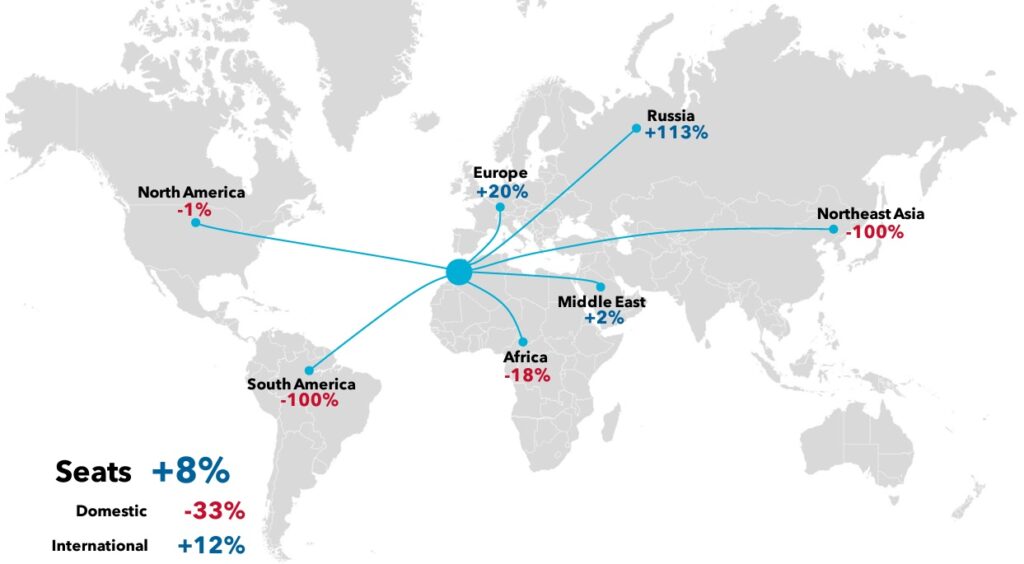
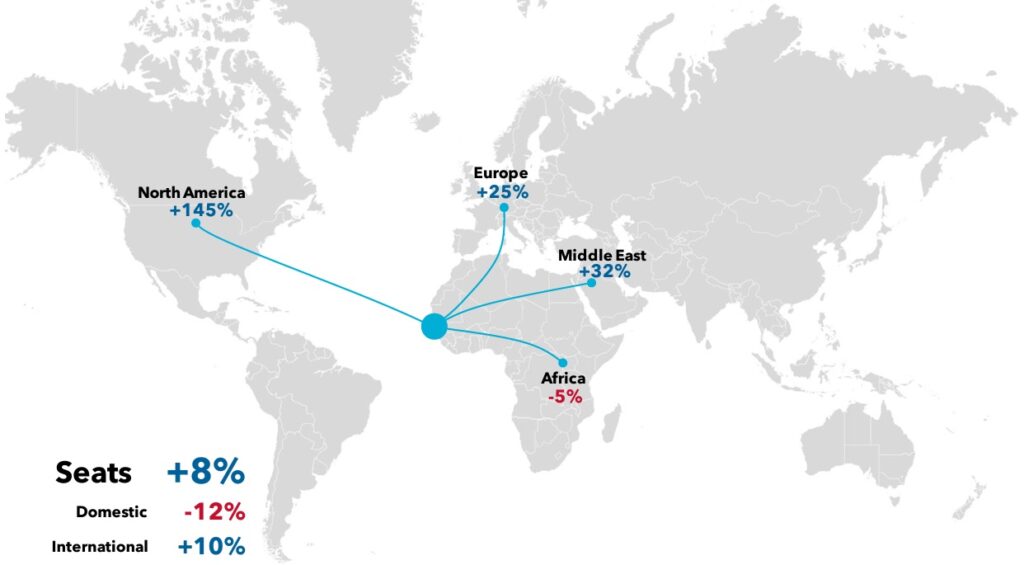
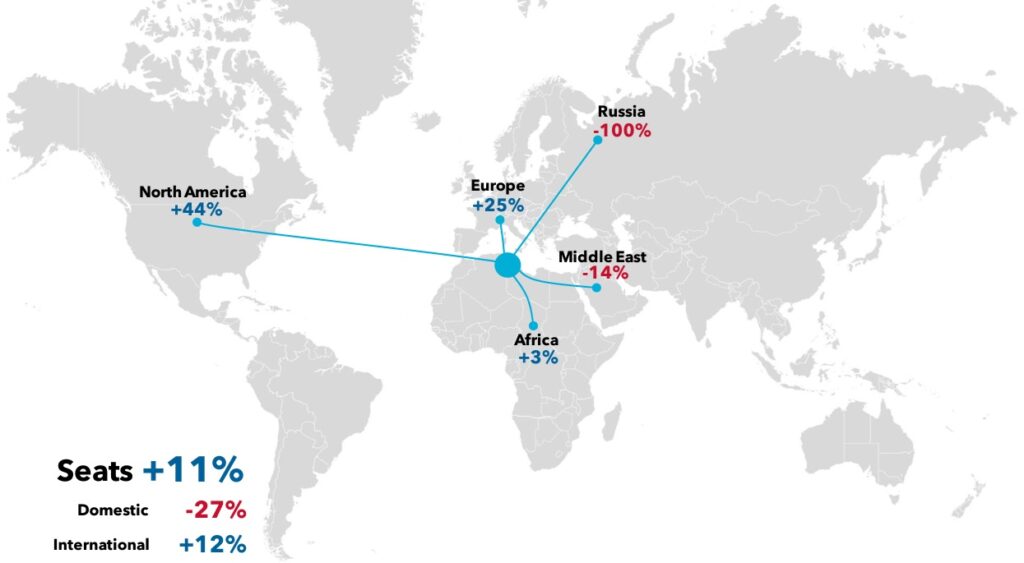
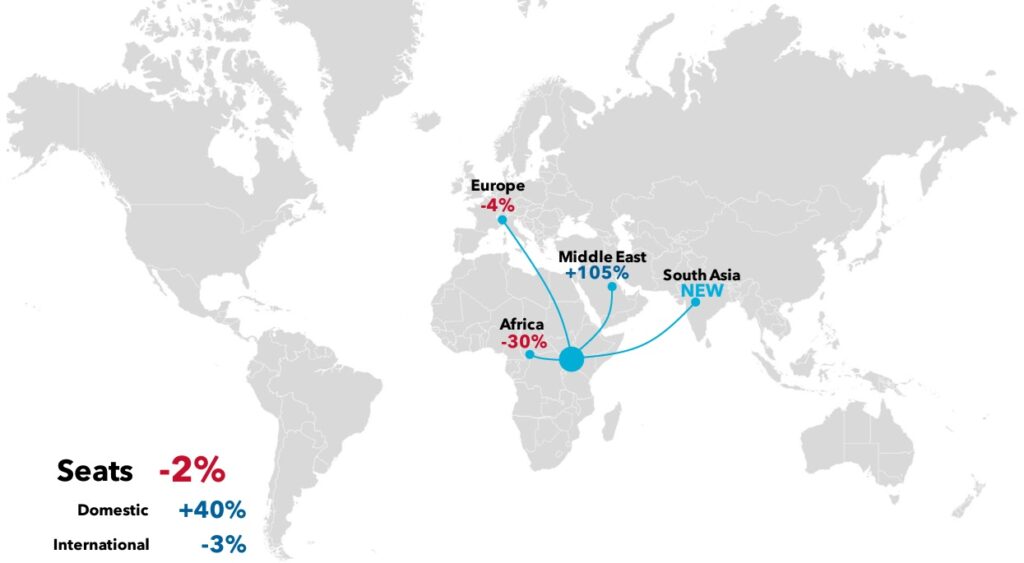
The recovery in the domestic and international segments has been fairly balanced, with seats 2-3% above their 2019 level. Some international markets have exceeded these figures by some margin. Expansion by Air Algerie has driven a dramatic increase in capacity to Russia. Having previously operated only a weekly Algiers-Moscow service, it now flies four weekly services to Moscow and three to St Petersburg. Three markets have driven the one-third increase in Middle East capacity. Air Algerie has started flying to Qatar, where Qatar Airways has also added seats. The Algerian carrier has also increased flights to the U.A.E. (Dubai). Saudi Arabia has made the biggest contribution with seats more than 70% higher. While Air Algerie has increased flights by one-third, Saudia has expanded seat capacity by 180% and Saudi airline Flynas has now entered the market.
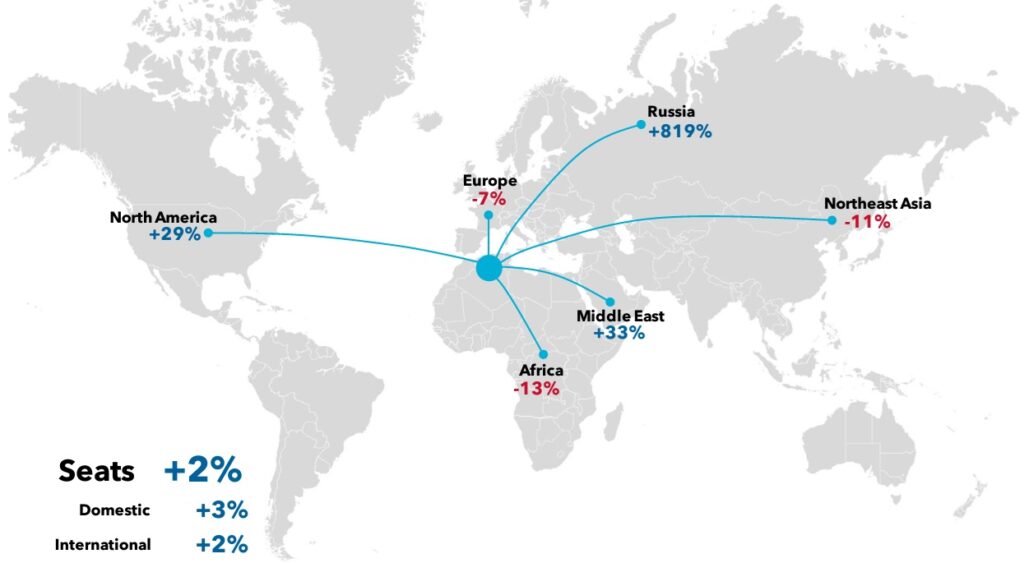
Source: BCD analysis of OAG data, January 2024 v 2019, non-stop flights only
Algeria
Average ticket prices in 2023
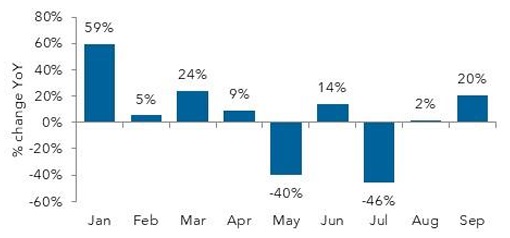
Short-haul
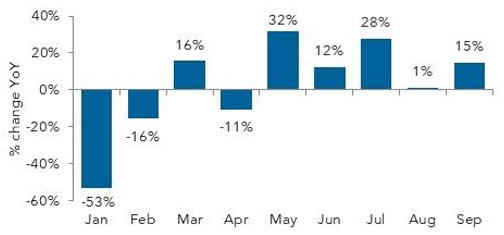
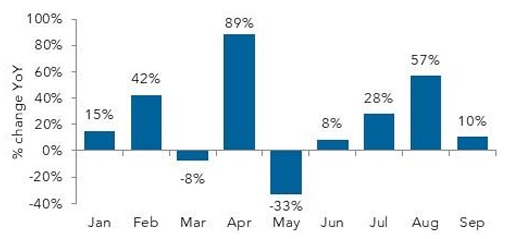
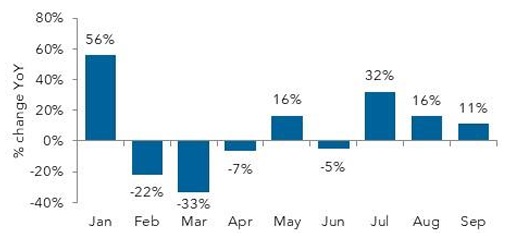
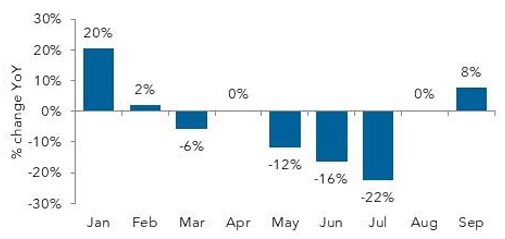
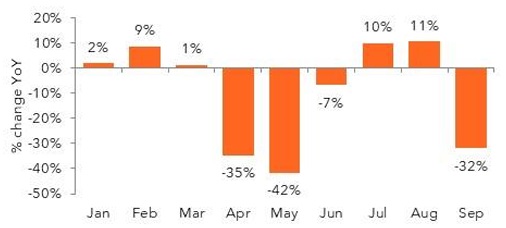
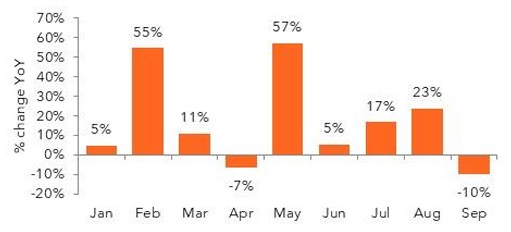
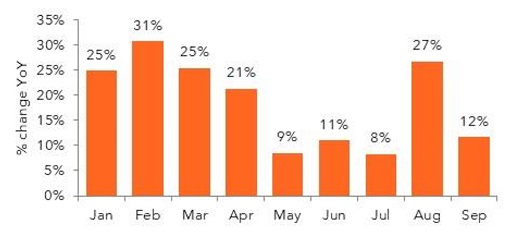
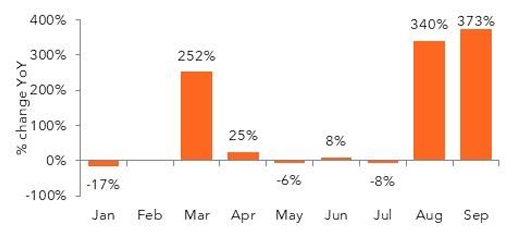
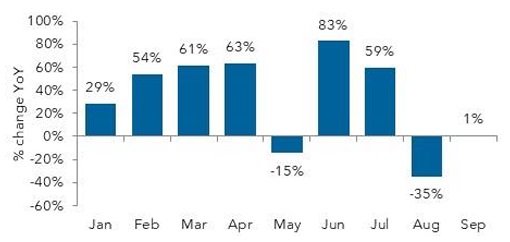
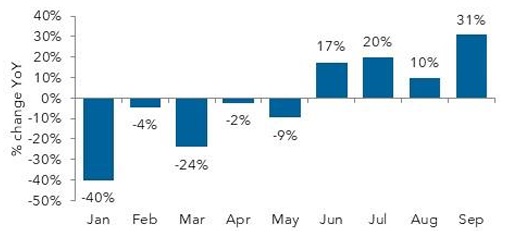
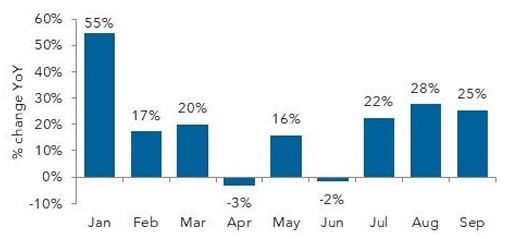
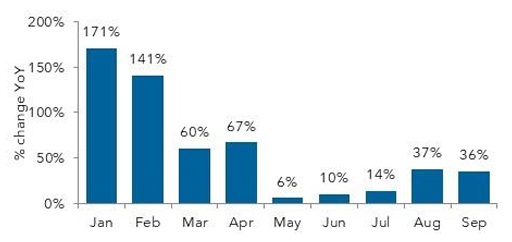
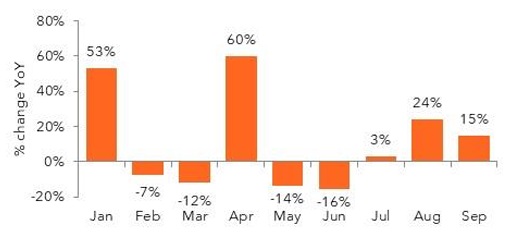
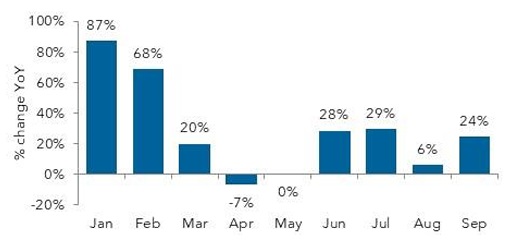
Average ticket prices in 2023 Short-haul During the first nine months of 2023, while airfares were on average only 3% higher year over-year (YoY), they were more than one-third above their 2019 level. The YoY number had been depressed by big price falls at the start of the year. ATPs rose YoY in every month from May, with increases ranging from 1% to 32%.
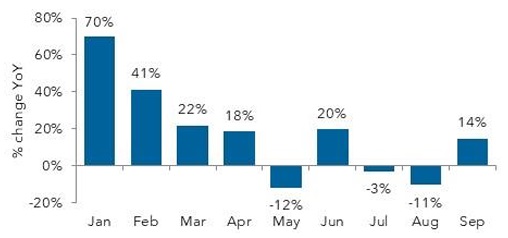
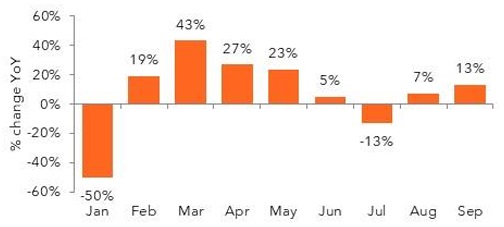
Long-haul
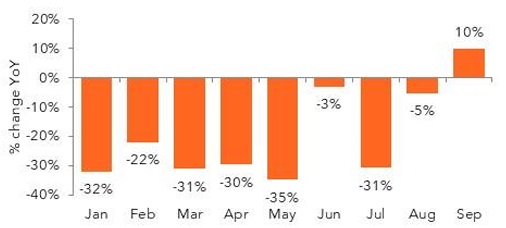
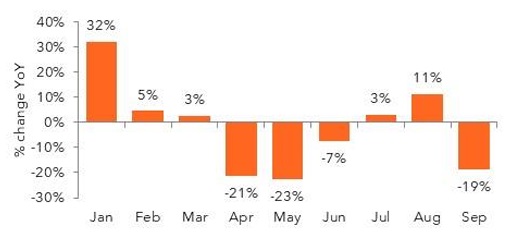
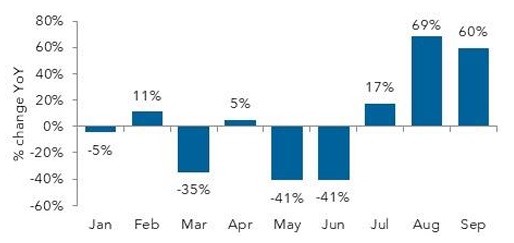
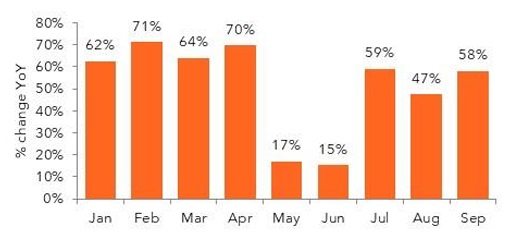
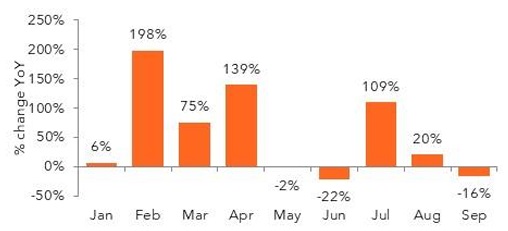
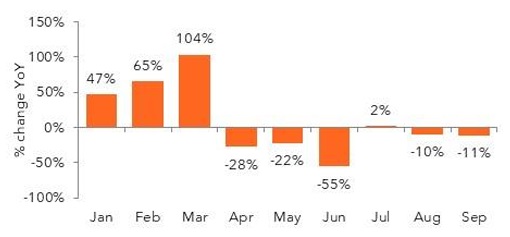
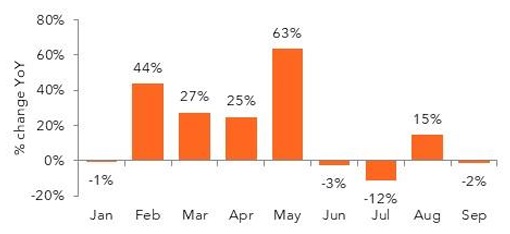
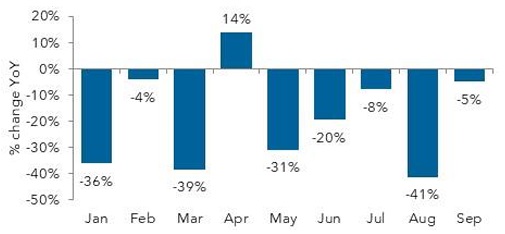
While 2023 was largely characterized by falling airfares, this was largely a correction from 2022’s high pricing. While ATPs in the first nine months were 21% lower YoY, this was still 37% higher than in 2019. The period of correction may have ended, however. Initial figures show August’s modest 5% dip followed by a 10% increase in September.
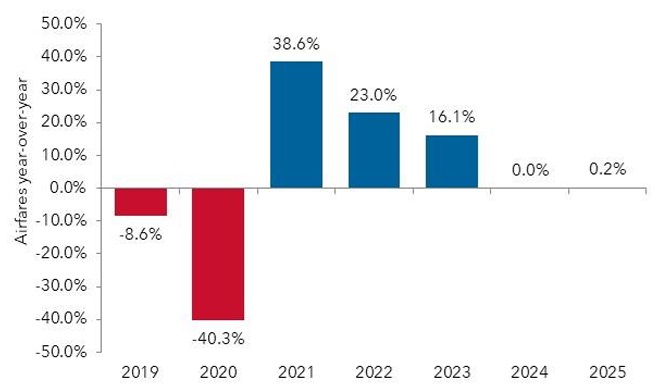
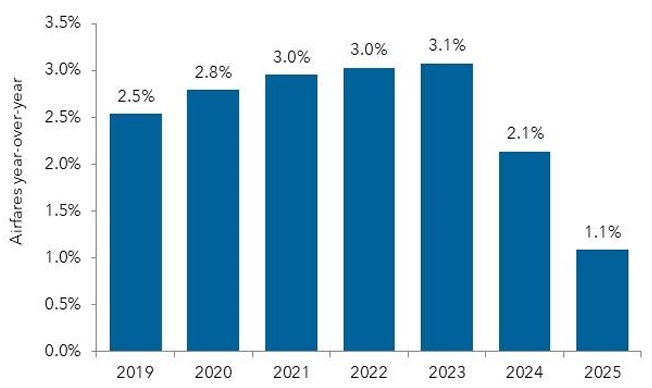
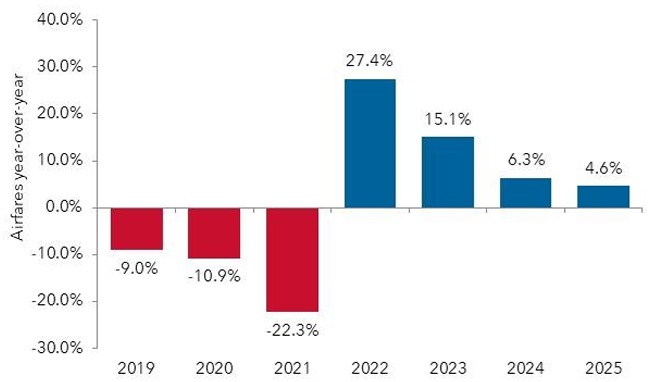
Outlook
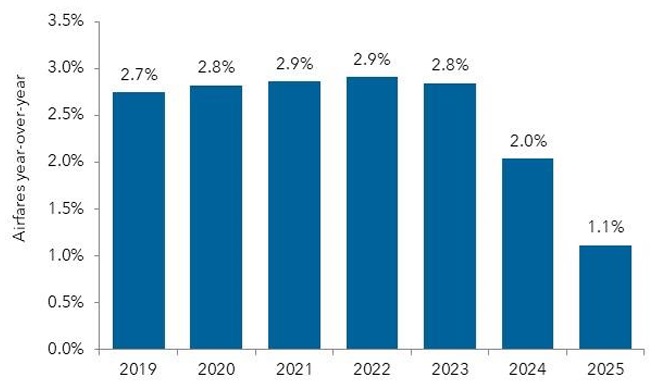
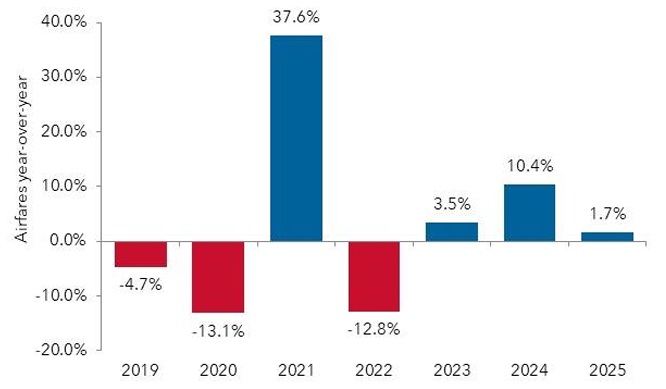
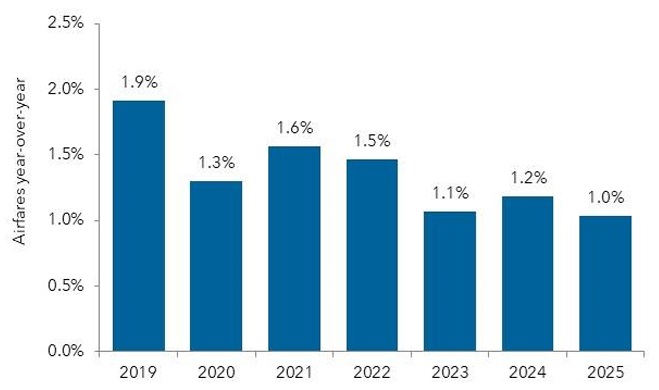
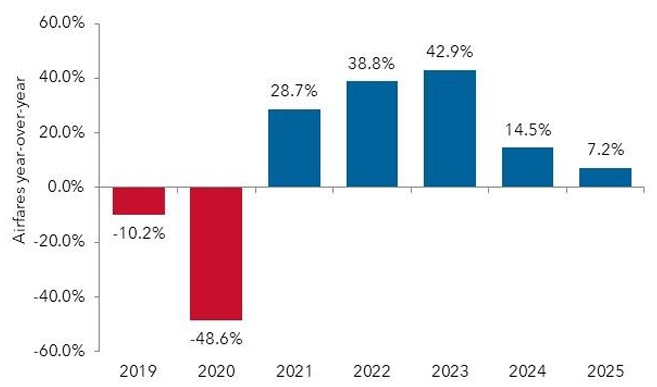
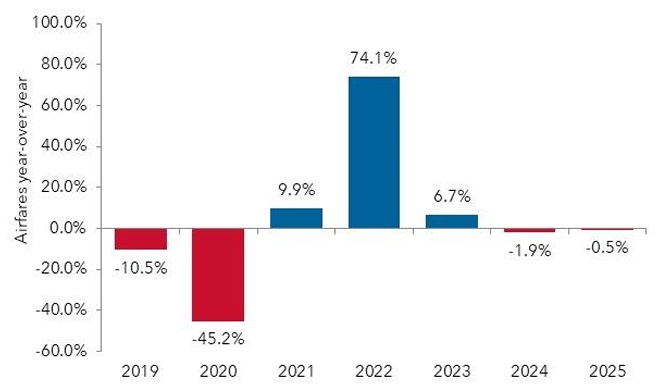
After a two-year slump in airfares caused by the pandemic, airlines enjoyed a two-year rebound. But this still left fares in 2023 12% short of a full recovery. And there’s little sign in IATA’s forecasts of them progressing much further in the near term.
This contrasts to corporate fares. As already outlined, prices for business fares are already around one-third higher than in 2019.
Source: BCD transactional data and IATA forecasts
Angola
Recovery in airline capacity
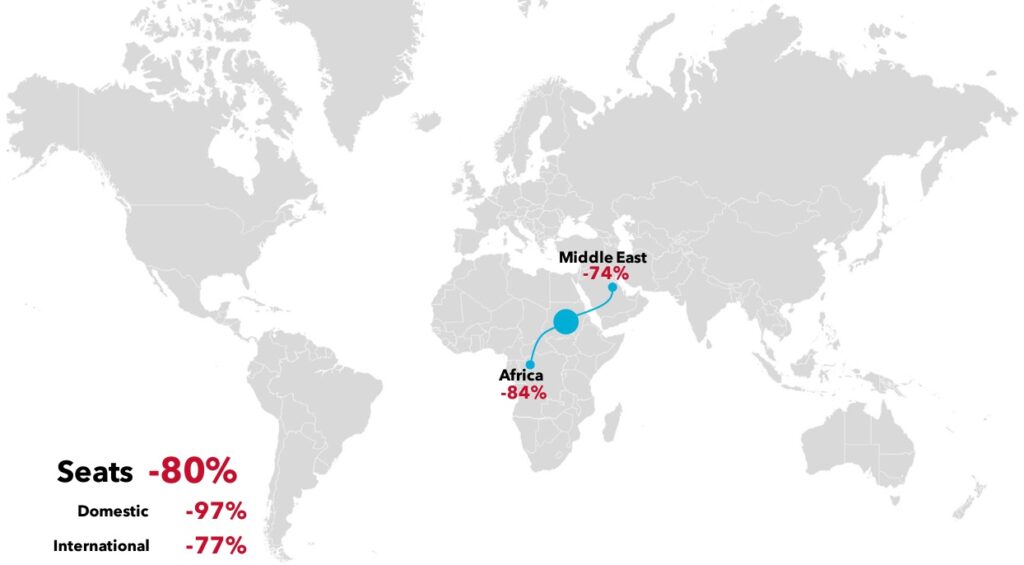
Summary
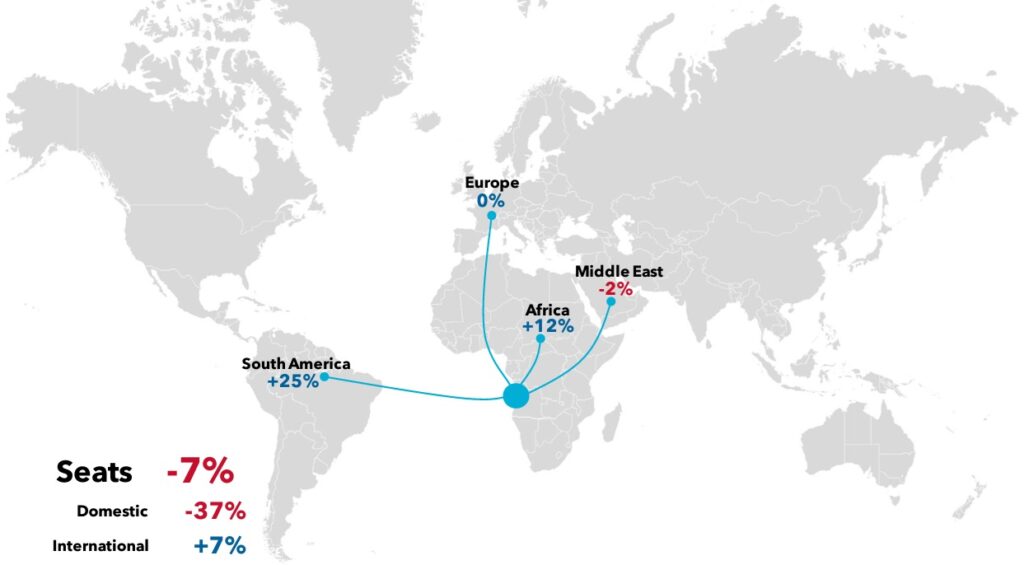
In 2019, domestic services had accounted for almost one-third of airline capacity in the Angola market. By the start of 2024, seats in this segment were still 37% lower. In contrast, international capacity is already 7% above 2019 levels.
The geographic extent of direct air services from Angola is limited to four regions. South America has seen the strongest capacity expansion, with a quarter more seats on offer than pre-pandemic. This is the result of TAAG upgrading its aircraft on the Luanda-Sao Paulo route, despite offering one less flight per week.
African routes have also seen 12% extra capacity. While services to Kenya, Zambia and Zimbabwe have yet to resume, Gabon, Togo are new markets. Significant capacity increases to Congo, DR Congo and Nigeria have offset less capacity to Morocco, Mozambique and Namibia.
Source: BCD analysis of OAG data, January 2024 v 2019, non-stop flights only
Angola
Average ticket prices in 2023
Short-haul
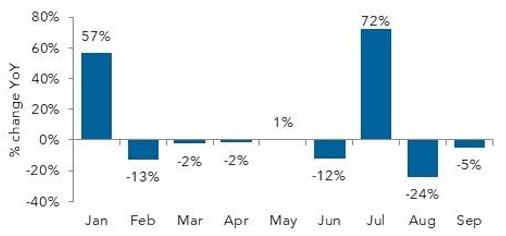
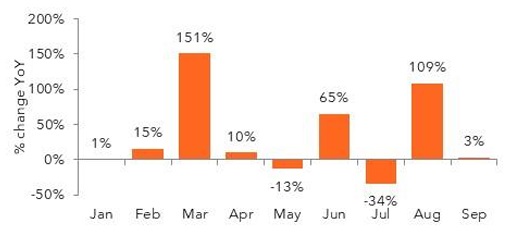
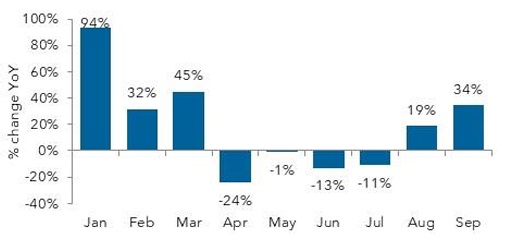
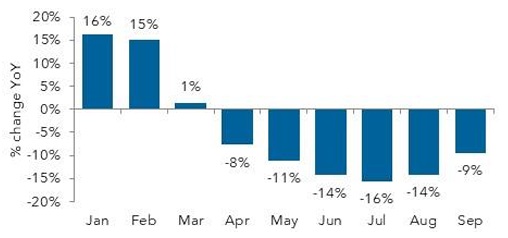
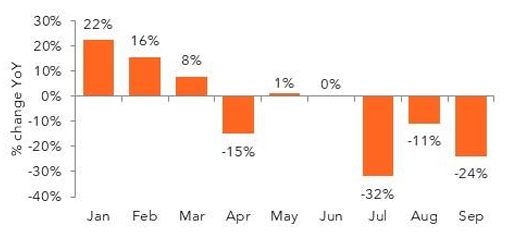
Aside from one or two erratic and steep increases in January and July, ATPs fell year-over-year (YoY) in most months. Decreases ranged between 2% and 24%.
While September’s 5% decrease showed the trend continuing, this still left short-haul fares 11% above their 2019 level.
Long-haul
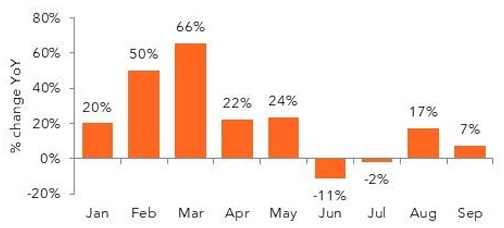
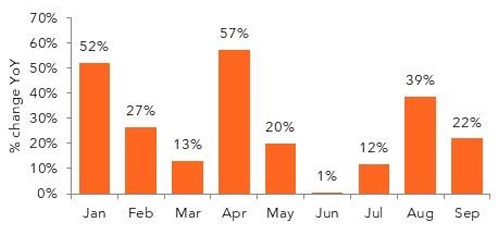
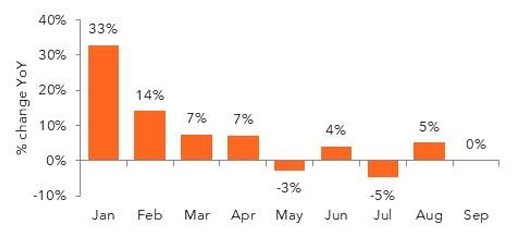
The pricing situation for long-haul fares has been quite different, with ATPs up on average by 22% so far in 2023.
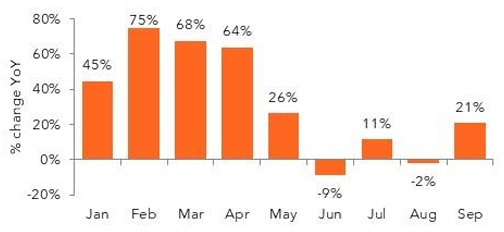
There is, however, a sense of a general moderation, with fares inflation easing from March’s 66% to 7% by \September.
The accumulated impact of these increases left ATPs 72% above 2019 in September.
Outlook
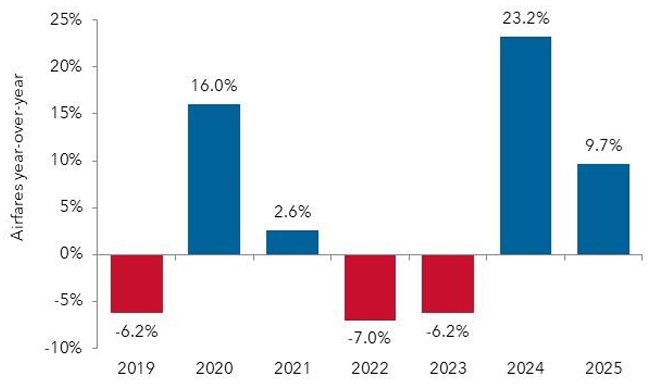
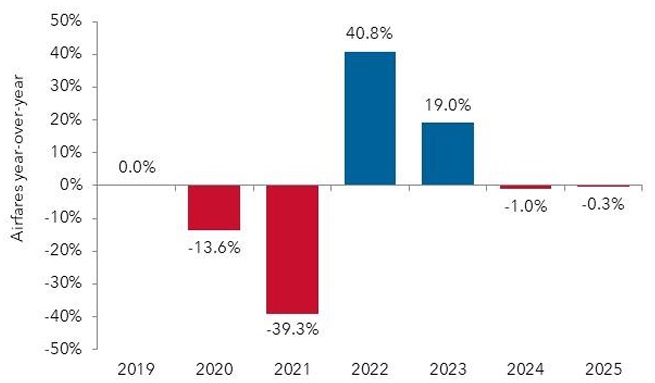
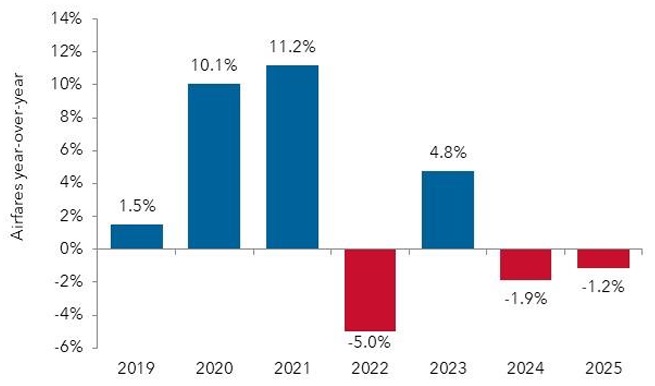
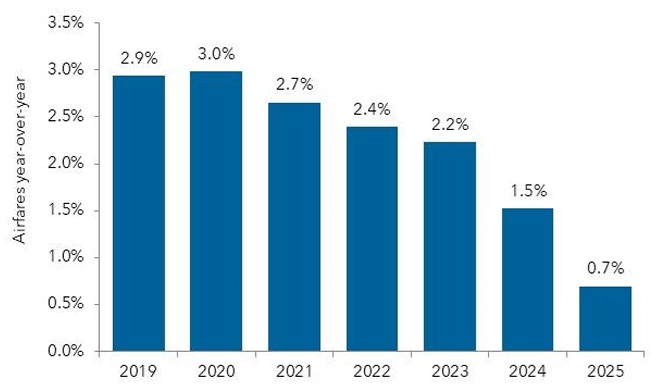
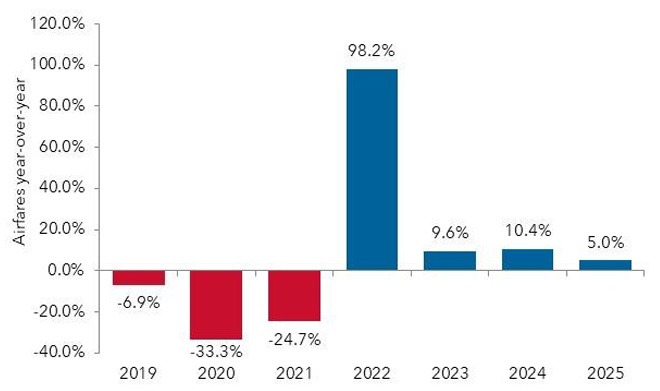
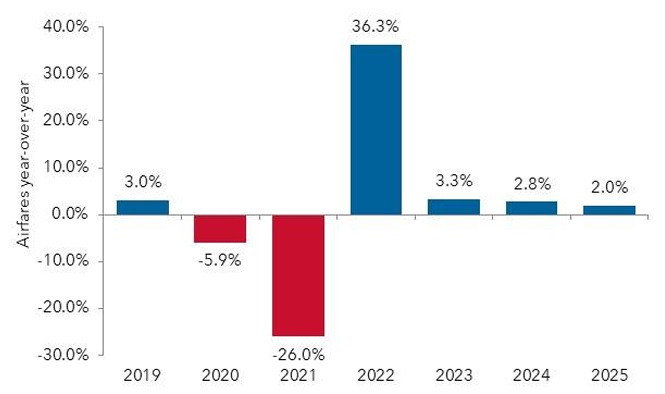
Despite the onset of the pandemic, fares increased in both 2020 and 2021. While two years followed, in which fares dropped by 6-7%, this should still have left fares 4% higher than in 2019.
IATA expects ATPs to regain some upwards momentum in 2024, when it forecasts a 23% increase, with a further 10% rise possible in 2025.
Source: BCD transactional data and IATA forecasts
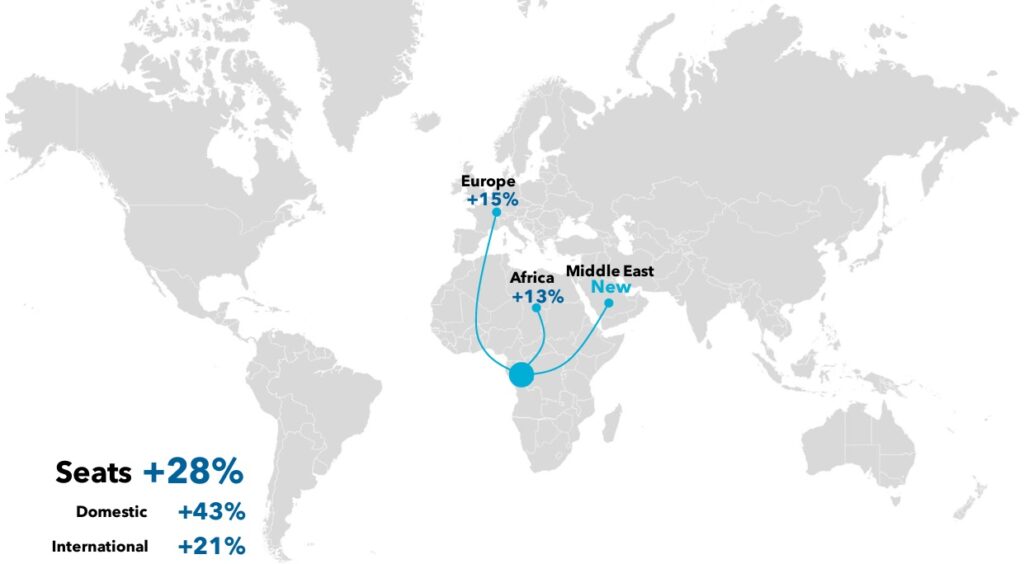
Cameroon
Recovery in airline capacity
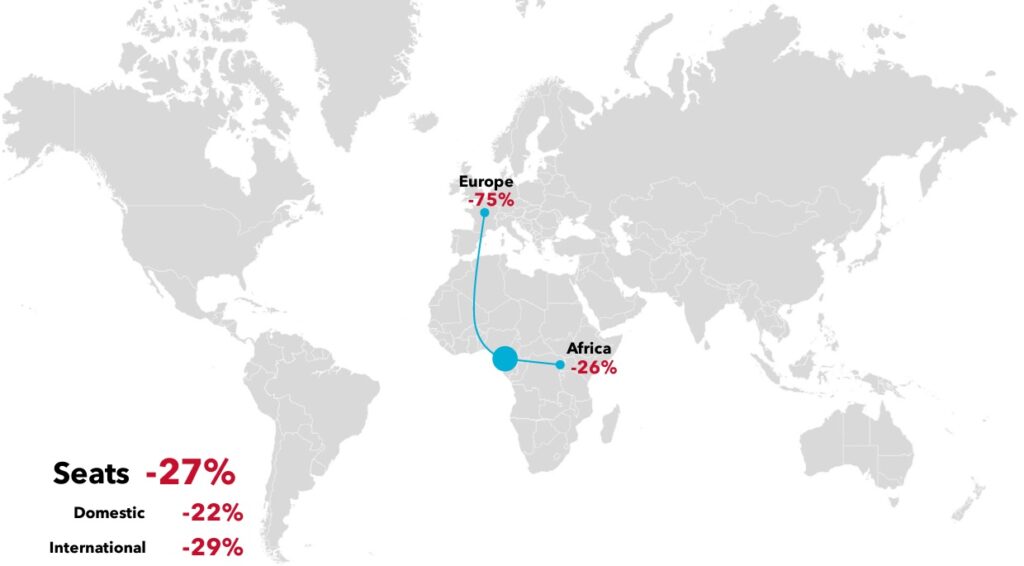
Summary
Both domestic and international seat capacity are still some way from returning to their pre-pandemic levels.
International services are confined to three regions: Africa, Europe and the Middle East. Of these, the latter has seen the strongest capacity response, with 33% more seats than in 2019, with Turkish Airlines upgrading aircraft and adding a single weekly frequency to Istanbul.
In contrast, capacity to African destinations is still down by more than one-fifth. Recovery across the region has been mixed.
Service has yet to resume to DR Congo, although Algeria and Egypt are newly connected to Cameroon. Capacity is still below 2019 to Benin, Chad, Congo, Cote d’Ivoire, Equatorial Guinea, Ethiopia, Gabon, Kenya and Nigeria. But it’s more than recovered above 2019 levels on flights to the Central African Republic, Morocco, Rwanda and Togo.
Source: BCD analysis of OAG data, January 2024 v 2019, non-stop flights only
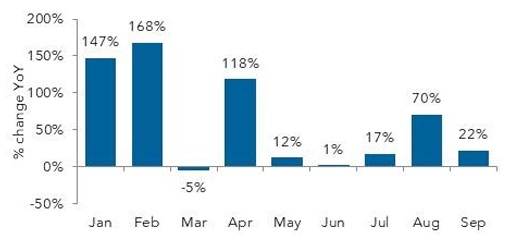
Cameroon
Average ticket prices in 2023
Short-haul
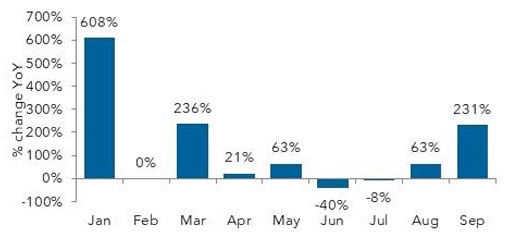
Across the first nine months of 2023, short-haul airfares rose by 22% in Cameroon. But there was a lot of fluctuation in the year-over-year calculations.
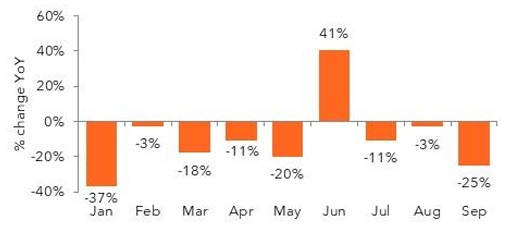
Long-haul
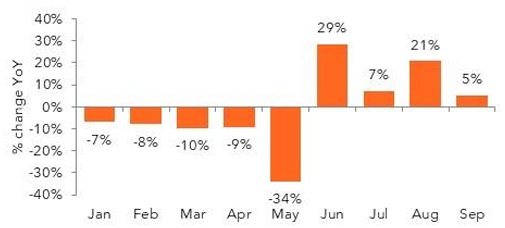
On average, long-haul fares were 3.5% lower during the first threequarters of 2023.
While fares fell year-over-year in four months, they also increased (typically by modest percentages) in five months. It’s hard to establish the current state of pricing in Cameroon.
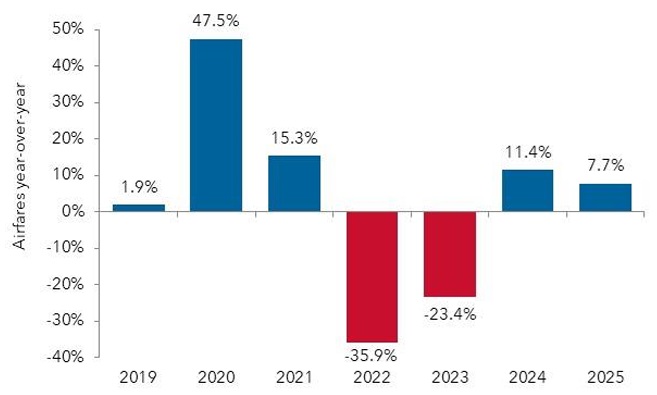
Outlook
According to IATA, airfares inflation strengthened from 1.5% to more than 10% in both 2020 and 2021. A subsequent decrease and rebound in the next two years should have left airfares in the Cameroon market 22% higher in 2023 than they had been pre-pandemic.
IATA expects a modest 1-2% decrease in fares per year through 2025.
Source: BCD transactional data and IATA forecasts
Chad
Recovery in airline capacity
Summary
Ethiopian Airlines, which had been Chad’s sole operator of domestic services in 2019, has not resumed operations, leaving the country without internal scheduled flights.
With Air France abandoning its nonstop N’djamena-Paris services in favor of a circular Paris-N’djamena-Abidjan-Paris routing, dual-direction non-stop flights from Chad to Europe have effectively ended. This has left Chad with outbound connections only to destinations in two regions: Africa and the Middle East.
Capacity on African routes is 6% above 2019. Although service to Kenya and Sudan has yet to resume, there are extra flights to Egypt, Ethiopia and Nigeria and new services launched to Niger.
With Turkish Airlines halving its N’djamena-Istanbul frequency to a single weekly service, Middle East capacity is 44% below 2019.

Source: BCD analysis of OAG data, January 2024 v 2019, non-stop flights only
Chad
Average ticket prices in 2023
Short-haul
After a generally weak first half, pricing for short-haul business travel strengthened from July, with year-over-year increases recorded in the last three months.
On average, during the first nine months, ATPs were up 8% YoY, pushing them almost 50% higher than in the same period in 2019.
Long-haul
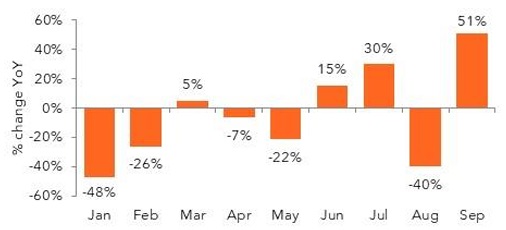
Fares for long-haul travel followed a similar, but more evident path. ATPs were generally lower YoY up until May.
From June, ATPs tended to increase YoY, and (August aside) at an ever-increasing rate.
September’s 51% rise still only left ATPs 34% higher than in 2019.
Outlook
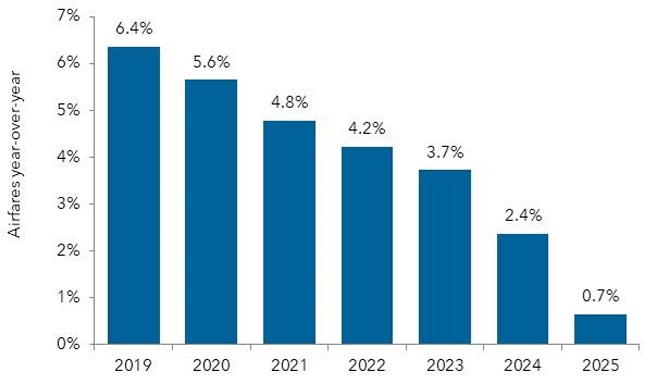
In spite of the pandemic, IATA has detected no decline in airfares in any year between 2020 and 2023. Instead, it does suggest a gradually declining level of airfare inflation, starting at 6.4% in 2019, and easing to 3.7% in 2023.
It expects this trend to continue over the next two years, and possibly accelerate in 2025, when the rise in fares could fall below 1%.
Source: BCD transactional data and IATA forecasts
Congo
Recovery in airline capacity
Summary
Both domestic and international seat capacity are well above their pre-pandemic levels.
France continues to be the only European market with service and there are now 15% more seats. However, standalone operations to Paris from Brazzaville and Pointe-Noire are today served in combination with Kinshasa and Luanda, respectively, potentially reducing available capacity to/from Congo.
African capacity is now 13% above 2019, but recovery has been mixed. Service has yet to be restored to Equatorial Guinea and capacity to Morocco is at just 27% of its pre-pandemic level. Recovery has also eluded services to Benin and Cameroon. But seats to Cote d’Ivoire, DR Congo and Ethiopia are far above their pre-pandemic levels.
There are now also direct services to the Middle East, with Turkish Airlines flying four weekly flights from Pointe Noire to Istanbul.
Source: BCD analysis of OAG data, January 2024 v 2019, non-stop flights only
Congo
Average ticket prices in 2023
Short-haul
Year-to-date, short-haul fares in the Congo market were 49% higher year-over-year.
The year started with some very high increases, which largely eased as the year progressed.
In general, price movements in the later months were much closer to 20%.
Long-haul
With one exception, long-haul fares fell in every month so far in 2023. On average, they were 4% lower. But this still leaves them more than 40% higher than they were in 2019.
Outlook
Fares increased sharply in 2020, with another double-digit rise following in 2021. Two year’s of rapidly falling prices followed, pushing average ticket prices in 2023 17% lower than they had been in 2019.
IATA expects the market to see some solid price rises in 2024 and 2025, which may succeed in returning airfares to their pre-pandemic level.
Source: BCD transactional data and IATA forecasts
Cote d’Ivoire
Recovery in airline capacity
Summary
While domestic capacity is now 5% higher than it was in January 2019, international seats are still 8% from a full recovery.
This is largely due to the slow return of capacity within Africa, which normally accounts for three-quarters of seats flown from Cote d’Ivoire. The recovery in seats to neighboring markets has been particularly weak. Capacity to Benin, Gabon, Liberia and Mali is around 50% below 2019, while there are no services to Equatorial Guinea.
European capacity is just 4% below 2019. While service to Portugal has not resumed, seats to France are 14% above pre-pandemic levels.
North America has seen strong growth with 50% more seats on offer, with Ethiopian Airlines adding a third weekly frequency to its Addis Ababa-Abidjan-New York services.
The expansion in Middle East capacity is the result of 29% extra seats to Turkey, courtesy of Turkish Airlines.
Source: BCD analysis of OAG data, January 2024 v 2019, non-stop flights only
Cote d’Ivoire
Average ticket prices in 2023
Short-haul
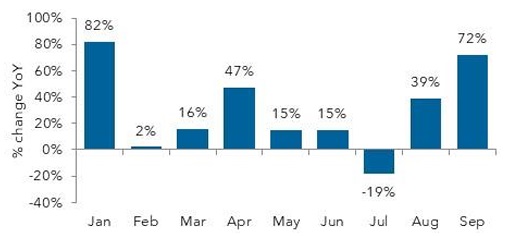
After a strong start, airfares inflation eased closer to 15% for much of 2023. But the year looked to be closing with a stronger pricing situation. By September, fares were rising by 72% year-over-year.
Across the first nine months of 2023, fares rose on average by one-third.
Long-haul
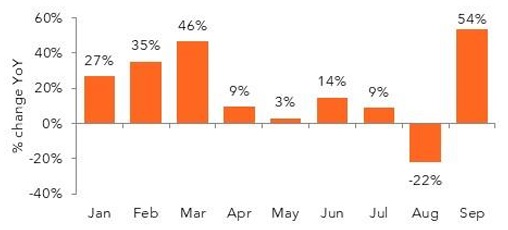
Airfares inflation on long-haul routes was building momentum in the first quarter, but this was largely lost during the middle of the year.
September’s numbers suggest airlines regained their pricing power, with average ticket prices moving more than 50% higher than last year.
Outlook
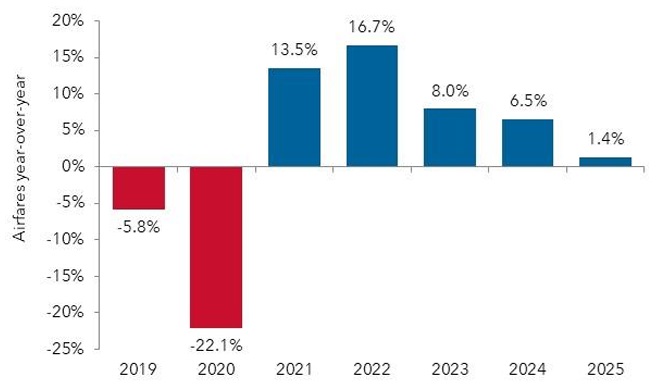
After falling sharply in 2020, airfares in Cote d’Ivoire rose strongly for two years, pushing them 3% above their 2019 level in 2022.
IATA expects an 8% increase in 2023, with fares inflation easing close to 1% by 2025. By this point, ticket prices could be 20% above their pre-pandemic level.
Source: BCD transactional data and IATA forecasts
Egypt
Recovery in airline capacity
Summary
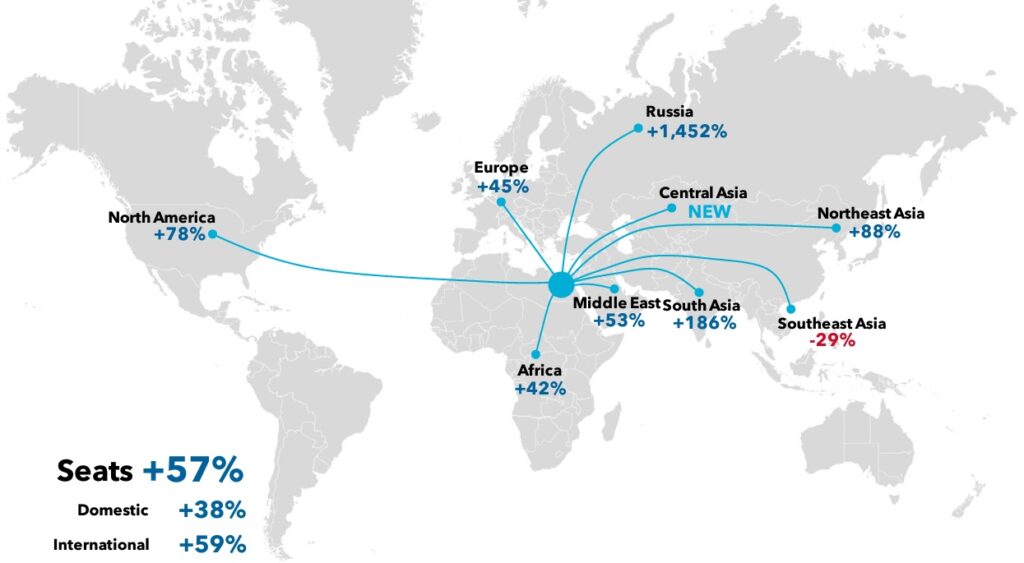
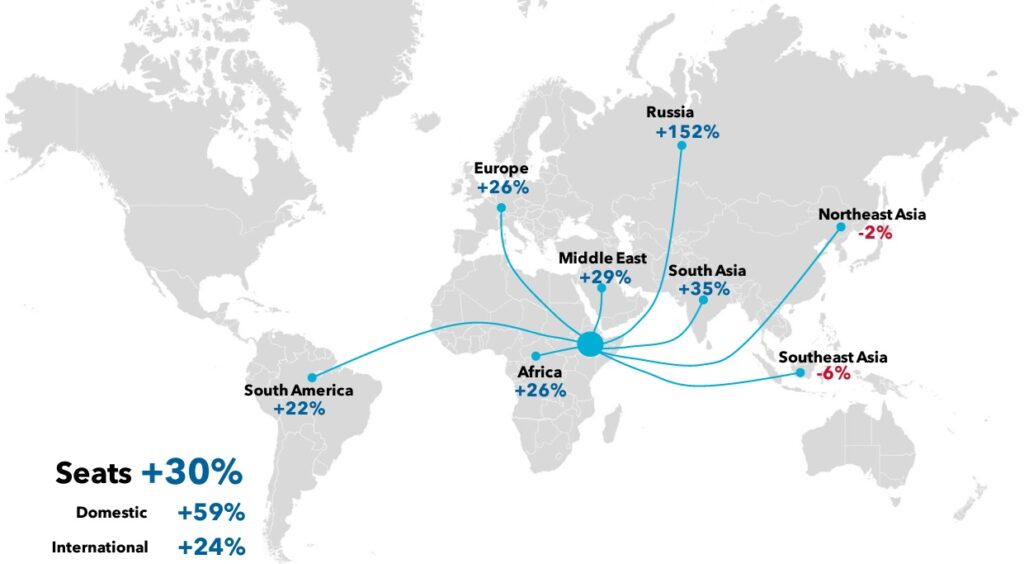
The capacity cuts of the pandemic are clearly a distant memory in Egypt, where airlines are today offering 57% more seats than in 2019. While international flights have led the way with 59% more seats, even domestic capacity is 38% higher.
The international schedule includes some extraordinary capacity growth on 2019 levels. Most notable is Russia, where travel restrictions in many markets have prompted a 1,452% jump in seats to Egypt. Capacity to South Asia is also 186% higher. EgyptAir has started four weekly flights from Cairo to Delhi, while the launch of two weekly flights to Dhaka has opened access to Bangladesh.
North American capacity is 78% up on 2019, with new thrice-weekly Egypt air services to Newark and Washington DC driving up U.S. seats by 84%.
Seats on Northeast Asia routes are 88% higher, with capacity to China already more than double pre-pandemic levels.
Source: BCD analysis of OAG data, January 2024 v 2019, non-stop flights only
Egypt
Average ticket prices in 2023
Short-haul
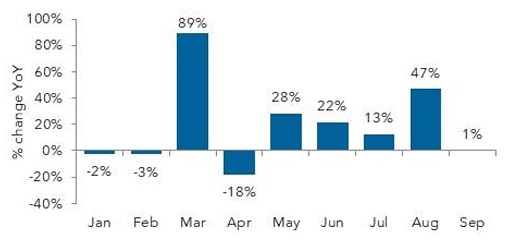
Up to September, year-over-year (YoY) movements in airfares in Egypt were erratic, ranging from April’s 18% decrease to March’s 89% surge.
A slowdown in airfares inflation was emerging during the summer months but was interrupted in August. Initial numbers for September suggest prices may have been stabilizing.
Long-haul
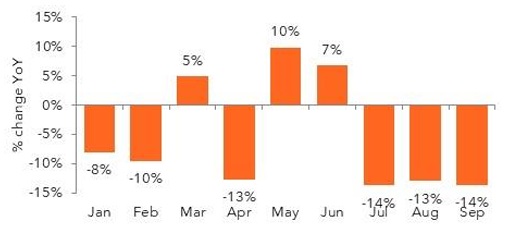
In most months of 2023, long-haul fares were 10-14% lower YoY. On average, fares during the first nine months were 4% lower, but this number was inflated by occasional increases in March, May and June.
Airfares inflation was stable at 13-14% over the latest three months.
Outlook
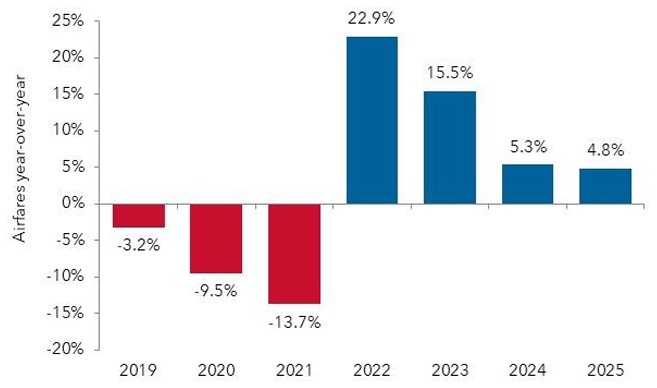
An already weak pricing environment worsened in 2020 and further still in 2021, pushing Egyptian airfares 22% lower than in 2019. However, within a year, they were just 4% lower, and by 2023, IATA anticipates them moving 11% above 2019.
After two years of double-digit increases, IATA expects airfares inflation to moderate to around 5% for the next two years.
Source: BCD transactional data and IATA forecasts
Equatorial Guinea
Recovery in airline capacity
Summary
Air connections from Equatorial Guinea are limited to domestic flights and international services to destinations in Africa and Europe.
Domestic services are still more than one-fifth below their pre-pandemic level, as airlines have yet to fully restore services on the key Malabo-Bata route.
The African situation is mixed. While capacity to Ethiopia and Gabon is far above 2019 levels, seats to Cameroon are 40% lower and service has yet to return to Congo, Sao Tome and Togo.
European capacity is concentrated on Spain. What was previously a four times weekly service to Madrid has yet to reach even a weekly frequency so far in 2024.
Source: BCD analysis of OAG data, January 2024 v 2019, non-stop flights only
Equatorial Guinea
Average ticket prices in 2023
Short-haul
This is a small market with limited corporate air travel. As a result, sharp fluctuations in average ticket prices are possible.
Generally, airfares in 2023 tended to be much higher year-over-year.
Long-haul
Bookings for long-haul trips have been much higher, delivering more meaningful data.
Airfares had been falling during the first five months of 2023. But the second half of the year was characterized by higher fares, whose magnitude eased a little.
Outlook
Section deliberately left blank due to absence of data.
Source: BCD transactional data and IATA forecasts
Ethiopia
Recovery in airline capacity
Summary
Ethiopian Airlines’ expansion has already driven domestic and international seat capacity far above pre-pandemic levels.
Despite withdrawing from most non-hub routes, Ethiopian has added flights to a number of the 16 routes it operates from Addis Ababa, lifting domestic capacity by 59%.
On international routes, seats are typically 20-35% above their pre-pandemic level.
Africa accounts for most seats and capacity has been boosted by the addition of Algeria, Botswana, Burkina Faso and C.A.R. to the list of countries with direct services from Ethiopia. While not served on a non-stop basis from Ethiopia, weekly flights to the U.S. have increased by almost a quarter to 26. While service has ended to Houston, Atlanta is newly served and there are extra flights to Chicago and Washington DC.
Source: BCD analysis of OAG data, January 2024 v 2019, non-stop flights only
Ethiopia
Average ticket prices in 2023
Short-haul
Despite rising by 20% in January, during the first nine months of 2023, average ticket prices declined by 4%.
What had looked like a period of ever deepening decreases ended in August, and September’s numbers suggest a new period of rising fares had started.
Long-haul
The long-haul segment started the year in strong fashion, with fares jumping by more than 60% in three months. Since June, however, the situation became more mixed.
With ticket prices falling in some months, but rising by more than 20% in September, it’s hard to speculate where fares in the Ethiopian market were headed in the final quarter.
Outlook
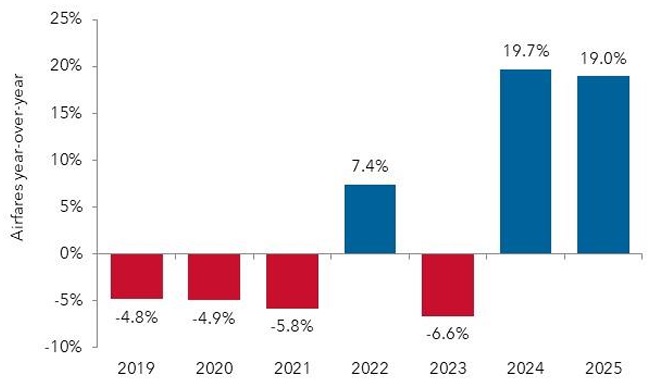
In a market where fares fell by almost 5% in 2019, the pandemic appeared to have little material impact. According to IATA, fares essentially continued to fall at this pace in both 2020 and 2021. After a brief rebound in 2022, average tickets should have fallen again in 2023, by almost 7%.
The near-term prospects are more encouraging. IATA expects fares to jump by close to one-fifth in each of the next two years. By 2025, average ticket prices could be 28% higher than in 2019.
Source: BCD transactional data and IATA forecasts
Gabon
Recovery in airline capacity
Summary
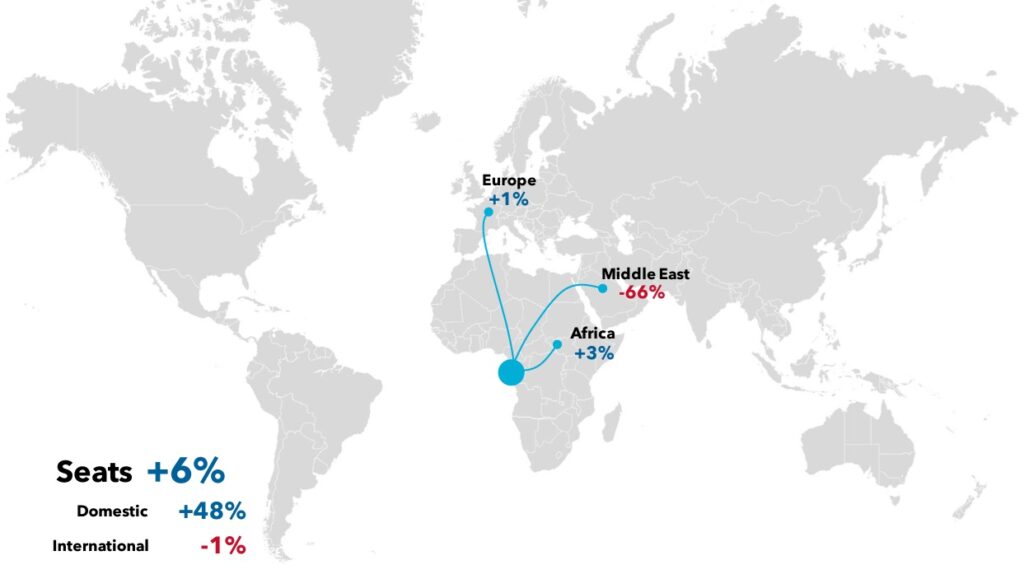
Domestic capacity, which now accounts for more than a fifth of seats in the Gabonese market, is almost 50% above its pre-pandemic level. Afrijet has added flights to Franceville and Port Gentil from Libreville.
In the international segment, capacity to other African countries is 3% above 2019. Angola, Ethiopia and South Africa are newly-served markets and capacity has expanded to Congo, Nigeria, Rwanda, Sao Tome and Togo. But seats are still much-reduced on flights to DR Congo, Cote d’Ivoire, Equatorial Guinea and Mali.
European capacity is back at 2019 levels, with capacity on the Libreville-Paris service fully restored, despite one less flight per week.
But capacity to the Middle East is still 66% lower than in 2019, as a result of Turkish Airlines cutting non-stop services to Istanbul from four to just one per week
Source: BCD analysis of OAG data, January 2024 v 2019, non-stop flights only
Gabon
Average ticket prices in 2023
Short-haul
Year-over-year movements in short-haul airfares were quite volatile in 2023.
Depending on the month of travel, passengers could have paid 156% more or 41% less than in 2022.
September’s number suggests a more stable situation, but it’s not clear if this is sustainable.

Long-haul
The picture for long-haul fares is similarly mixed, with steep decreases recorded for some months, and more reasonable increases in others.
Outlook
The consistency of the historic numbers means these figures should be treated with some caution. It suggests a lack of access, on IATA’s part, to accurate numbers.
In the context of what may have happened between 2019 and 2023, IATA expects airfares inflation to ease in 2024, before slipping even lower in 2025.
Source: BCD transactional data and IATA forecasts
Ghana
Recovery in airline capacity
Summary
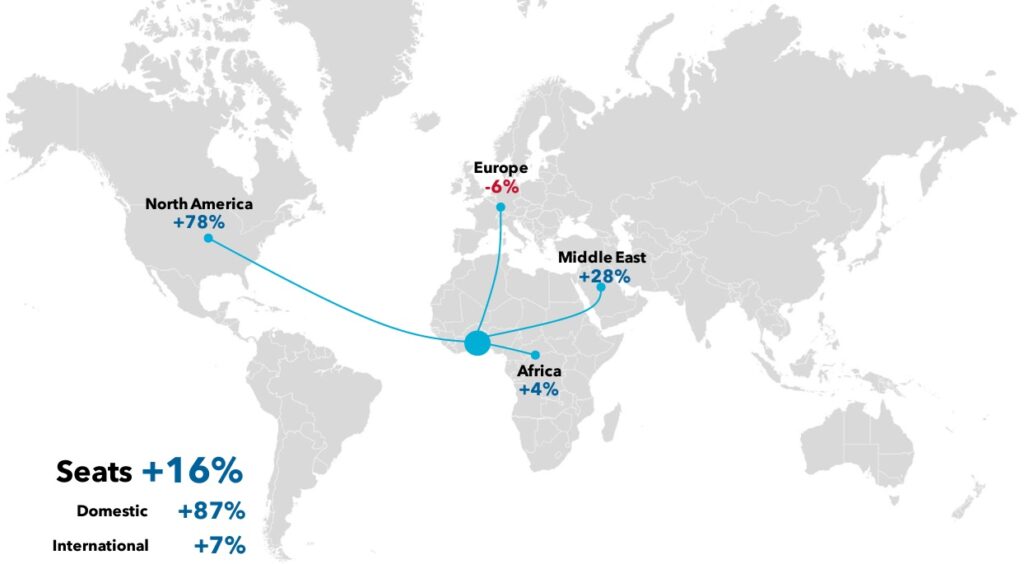
Airline capacity has recovered well, particularly for domestic travel, where airlines are offering 87% more seats than pre-pandemic.
International capacity is also 7% higher, with Europe the only region yet to see seats fully restored.
North American capacity has jumped by almost 80%. While Delta Air Lines has increased Accra-New York JFK services to daily, United Airlines has entered the market with daily flights to Washington DC.
The 28% expansion in capacity to the Middle East reflects extra flights to Istanbul and a new five times weekly service to Doha, Qatar, originating in Abidjan, Cote d’Ivoire.
The recovery of European capacity is mixed. There are already more seats to France, the Netherlands and the U.K. than in 2019. Seats have been much slower to return to Belgium and Portugal, while services to Italy have yet to resume.
Source: BCD analysis of OAG data, January 2024 v 2019, non-stop flights only
Ghana
Average ticket prices in 2023
Short-haul
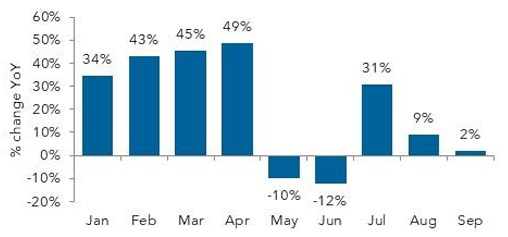
During the first four months of 2023, short-haul fare increases had been strengthening.
After a two-month interruption, increases resumed but at an ever-lower rate. By September, airfares inflation had slipped to just 2%.
Year-to-date, ticket prices averaged 19% higher.
Long-haul
Long-haul pricing was quite volatile in the first five months of the year.
A pattern of steadily rising price increases seemed to be emerging from June, only to be interrupted by September’s 10% decrease. It remains to be seen whether the trend of higher ticket prices resumed from October.
Outlook
Airfares were already falling pre-pandemic and then slumped by more than 40% in 2020.
After the initial rebound, year-over-year increases have steadily moderated. By 2023, IATA estimates fares had moved 18% above their 2019 level. But it expects no further upward movement in 2024 or 2025. In effect, fares will be falling in real terms.
Source: BCD transactional data and IATA forecasts
Kenya
Recovery in airline capacity
Summary
While there are now 13% more seats available for domestic travel than pre-pandemic, international capacity is still 8% from a full recovery.
Internal capacity may have recovered, but there are still 18% fewer seats to other African markets. Non-stop service has yet to resume to Angola, C.A.R., Congo, Djibouti, Mali, Mozambique and Sudan. But there’s extra capacity to Egypt, Ghana, Madagascar, Mayotte and Nigeria.
Southeast Asia is furthest from recovery, although this only requires Kenya Airways to add back two more weekly services to Bangkok.
Some of the strongest expansion has been to South Asia. Kenya has benefited from IndiGo’s international expansion, which has seen it launch daily Mumbai-Nairobi services.
A strong expansion of capacity to France (20%), Germany (161%) and the U.K. (72%) has helped drive European capacity 20% higher.
Source: BCD analysis of OAG data, January 2024 v 2020, non-stop flights only
Kenya
Average ticket prices in 2023
Short-haul
During the first nine months of 2023, short-haul ticket prices increased by 17% year-over-year.
As the year proceeded, it’s possible to detect an underlying trend of weaker increases, ending with September’s 14% rise.
Long-haul
Fare development in 2023 was essentially characterized by two phases. A period of high inflation saw fares rise by 20-30% during January-April.
In general, airfares inflation was much closer to 10% in the May-September period.
Outlook
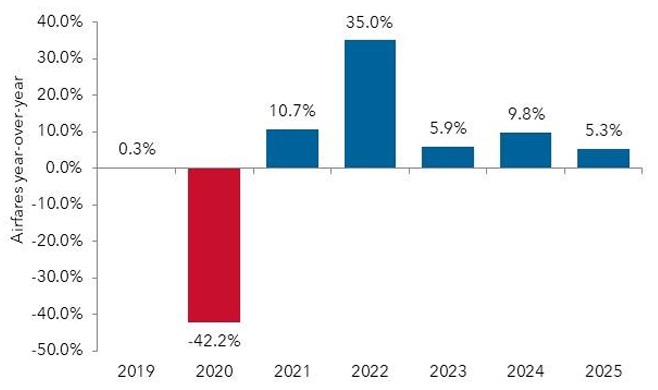
After dropping by 42% in 2020, Kenyan airfares may take up to four years to rebuild, despite rising by 35% in 2022.
Price increases eased to 6% in 2023, and the 10% rise IATA expects for 2024 should finally return fares to their 2019 level.
Source: BCD transactional data and IATA forecasts
Libya
Recovery in airline capacity
Summary
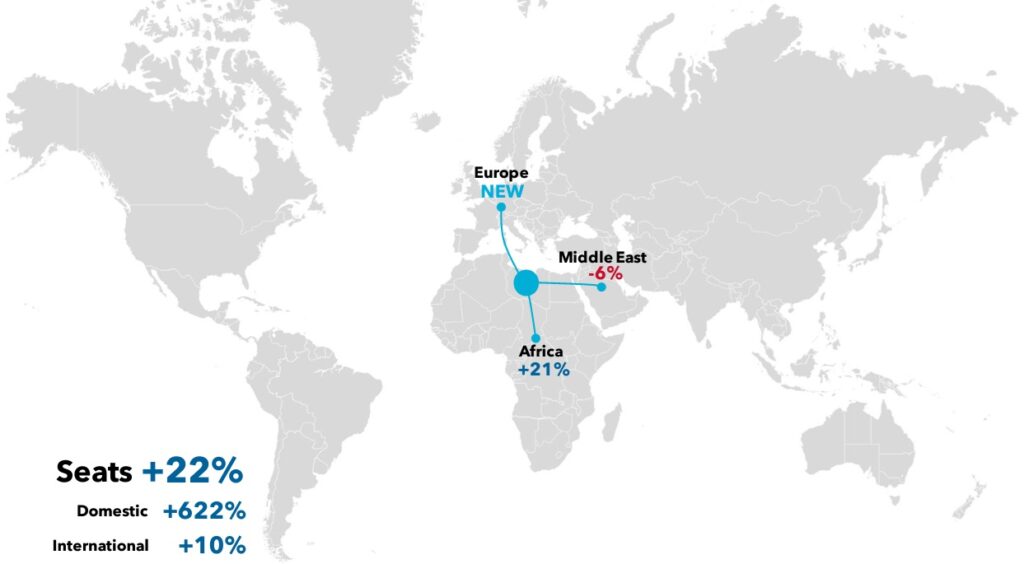
Libya is a market in recovery, not just from the pandemic, but from civil conflict. This latter development is reflected in a 622% surge in capacity for domestic air travel, although few routes attract more than one or two flights per week.
The country’s progress has also seen direct air links re-established with Europe, albeit limited to three weekly flights from Benghazi to Athens.
Most capacity operates to cities in other African countries, and to Egypt and Tunisia in particular, where seats have increased by 147% and 10% on 2019 levels, respectively.
The Middle East is also an important market. The effects of significant capacity shortfalls to Jordan and Saudi Arabia have almost been offset by a doubling of seats to Turkey.
Source: BCD analysis of OAG data, January 2024 v 2020, non-stop flights only
Libya
Average ticket prices in 2023
Short-haul
Intermittent travel activity in this market means that there is no data for certain months.
Where numbers are available for year-over-year comparisons, they suggest either steep movements of 50% or more, or minimal change
Long-haul
Similar data issues exist for long-haul travel. Inflationary spikes in March, August and September could simply be a function of passengers taking longer distance trips.
Outlook
Section deliberately left blank due to absence of data.
Source: BCD transactional data and IATA forecasts
Mali
Recovery in airline capacity
Summary
Mali has restored domestic air services, with Sky Mali operating one or two weekly flights from Bamako to three other cities.
International air capacity, which is 11% below pre-pandemic levels, is focused on other African markets. Algeria, Benin, Ethiopia, Guinea, Togo and Tunisia have all seen capacity expanded, while Gabon is newly served. But services have yet to be restored to Kenya and Niger.
European capacity is only around one-quarter of its pre-pandemic level. Services to Germany have yet to resume, while seats to France are down 69%. With Air France’s withdrawal, service has been reduced from daily to just twice-weekly, now operated by leisure carrier Corsair.
Capacity to the Middle East is up by around a half. Turkish Airlines has converted Bamako-Istanbul to a standalone non-stop service and added a fifth weekly frequency.
Source: BCD analysis of OAG data, January 2024 v 2020, non-stop flights only
Mali
Average ticket prices in 2023
Short-haul
The first seven months of 2023 saw fares fall year-over-year (YoY) almost as often as they increased.
A pattern may have emerged from August, with short-haul fares rising by 60% or more for two months.
On average, during the first nine months, fares were 2% higher than in the same period in 2022.
Long-haul
The performance of airfares for long-haul travel displays no discernable trend. Sharp YoY increases were interspersed between more modest rises and even some decreases.
This added up to a 35% average rise in air fares in Mali during the first nine months.
Outlook
The consistency of the historic numbers means these figures should be treated with some caution. It suggests a lack of access, on IATA’s part, to accurate numbers for the Mali market.
In the context of what may have happened between 2019 and 2023, IATA expects airfares inflation to ease in 2024, before moving even lower in 2025.
Source: BCD transactional data and IATA forecasts
Mauritania
Recovery in airline capacity
Summary
Domestic capacity is far from a return to normality, with seats 56% below pre-pandemic levels.
The picture is mixed among African destination markets. Direct services now operate to Benin and Gambia, and capacity has been expanded to Algeria and Guinea. But there’s now much less capacity on offer to Mali, Morocco and Senegal.
Turkish Airlines has opened new links between Mauritania and the Middle East. It flies four weekly non-stop flights to Istanbul from Nouakchott and two in combination with Banjul.
The 20% rise in European capacity has been driven by a 45% increase in seats to France. Air France has lifted weekly frequency on its Conakry-Nouakchott-Paris service to four flights
Source: BCD analysis of OAG data, January 2024 v 2020, non-stop flights only
Mauritania
Average ticket prices in 2023
Short-haul
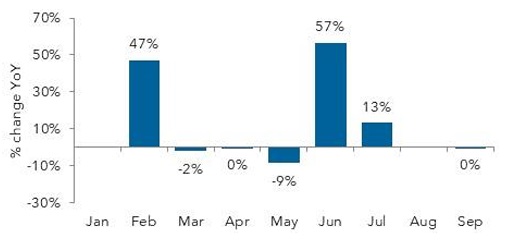
Airfares inflation had been building momentum as 2023 progressed. But this was lost at the end of the summer, with ticket prices down 35% in August and barely rising in September.
The strength of earlier increases still means airfares were up on average by 36% so far in 2023.
Long-haul
In most months, average ticket prices for long-haul travel broadly increased by 50-70%.
Upward momentum appeared lost in May and June, but it seems to have been restored since then.
During the first nine months, airfares rose on average by 47%.
Outlook
Section deliberately left blank due to absence of data
Source: BCD transactional data and IATA forecasts
Mauritius
Recovery in airline capacity
Summary
While domestic capacity is already 13% above its pre-pandemic level, it accounts for just 5% of total capacity.
Seats on international flights are just 2% from recovery, but progress varies significantly across the regions. Services to Northeast Asia (China and Hong Kong) have yet to resume, and capacity to Southeast Asia is still down by a half. While there are new connections to Malaysia, services to Singapore have not been restored.
Extra seats to Saudi Arabia, Turkey and the U.A.E. have pushed Middle East capacity 10% higher.
South Asia capacity has expanded by almost a quarter. Air Mauritius has yet to resume twice-weekly flights to Bangalore, and it’s held Delhi at three per week. But it has increased Mumbai services to six per week, where it now competes with new entrant Vistara’s five weekly flights.
In Southwest Pacific, an extra weekly Air Mauritius service to Perth has increased seats by 24%.
Source: BCD analysis of OAG data, January 2024 v 2020, non-stop flights only
Mauritius
Average ticket prices in 2023
Short-haul
It was a period of two halves for short-haul pricing in Mauritius. The first five months were characterized by falling fares. From June, however, ticket prices rose year-over-year, with the level of increase heading upwards to 31% by September.
Year-to-date, airfares were on a par with the same period in 2022.
Long-haul
The year-over-year movement in long-haul fares was mixed. Any upward movements were generally falling, easing to 20% in August. But these were interspersed with occasional price decreases, such as September’s 16% fall.
On average, long-haul fares were 49% higher than in 2022.
Outlook
Fares fell by almost 5% in the year before the pandemic and retreated by a further 13% in 2020. While 2021’s 38% surge propelled prices 20% higher than in 2019, this proved to be a temporary reprieve.
Another year of falling fares and a modest increase in 2023 resulted in ticket prices just 8% higher. But IATA predicts an upturn in the market’s fortunes in 2024, when it forecasts a 10% increase in fares.
Source: BCD transactional data and IATA forecasts
Morocco
Recovery in airline capacity
Summary
International services have driven the 8% recovery in seats in the Moroccan market. Capacity on domestic services is still one-third lower than pre-pandemic.
Services have yet to resume to Northeast Asia (China) or South America (Brazil), but neither was a major market in the past.
Recovery is largely due to a 20% expansion in capacity to Europe, a market normally accounting for three-quarters of international seats. There has been strong growth to Belgium, France, Germany, Ireland, Italy, Poland, Spain, Sweden and the U.K. But seat capacity remains heavily depressed to Austria, Czech Republic, Denmark and Greece, and Finland has yet to be reconnected.
African capacity remains almost one-fifth from recovery. While there are far fewer seats to Benin, Cameroon, DR Congo, Guinea-Bissau and Mali, capacity has expanded to Cape Verde, Cote d’Ivoire and Nigeria.
Source: BCD analysis of OAG data, January 2024 v 2020, non-stop flights only
Morocco
Average ticket prices in 2023
Short-haul
During the first nine months of 2023, short-haul fares were on average 5% higher than in 2022. But there’s been a lot of variation across the months. May and July’s fare decreases resulted from comparisons with price spikes in the same months in 2022.
The underlying trend was for fare increases in the 10-20% range.
Long-haul
On average, long-haul fares were 11% higher in the first nine months. Lower fares in January and July reflected heavily inflated prices in these months in 2022.
After easing in the middle of the year, price inflation strengthened from August, reaching 13% in September.
Outlook
An already weak fares environment deteriorated further in 2020, and by 2021, prices were more than 30% lower than in 2019.
The Moroccan market has since enjoyed two years of pricing recovery, which has moved fares 2% above 2019. IATA expects the inflation in airfares to moderate, averaging close to 5% over the next two years.
Source: BCD transactional data and IATA forecasts
Mozambique
Recovery in airline capacity
Summary
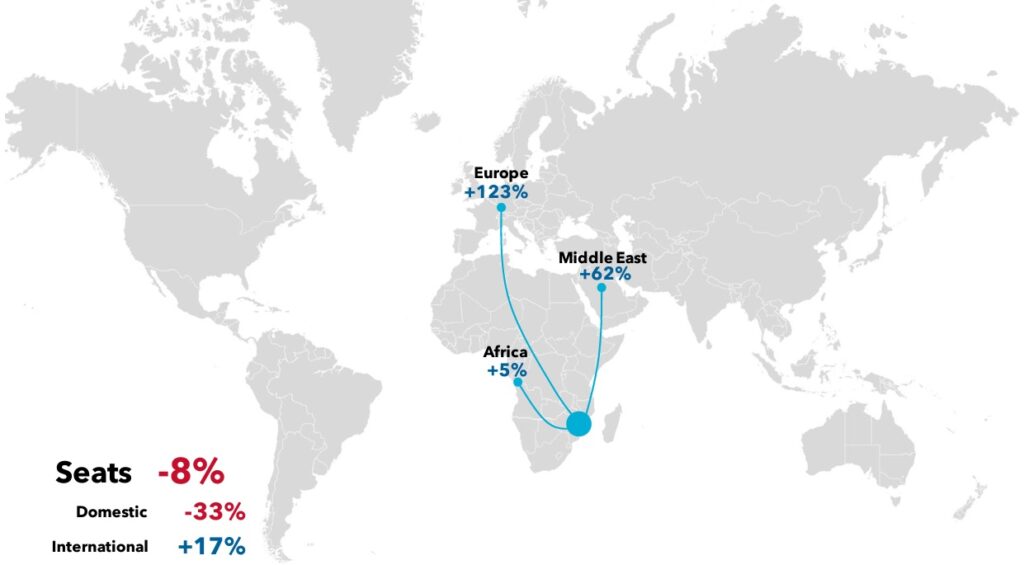
With domestic flights normally accounting for almost half of seats in the Mozambique market, their delayed recovery has resulted in total seats 8% below pre-pandemic levels.
International seats are already 17% higher. Africa, the largest market, has posted a 5% expansion. Ethiopia capacity has increased by two-thirds, with Ethiopian Airlines upgrading daily Maputo-Addis Ababa services from Boeing 737 to Boeing 787 and adding an extra flight from Beira.
Portugal is the only European market linked non-stop to Mozambique. Capacity has more than doubled, with LAM joining TAP Air Portugal in offering three weekly Lisbon services.
Qatar is the only Middle Eastern market directly linked to Mozambique. Seats are 62% higher, as a result of Qatar Airways increasing weekly flights from three to five.
Source: BCD analysis of OAG data, January 2024 v 2020, non-stop flights only
Mozambique
Average ticket prices in 2023
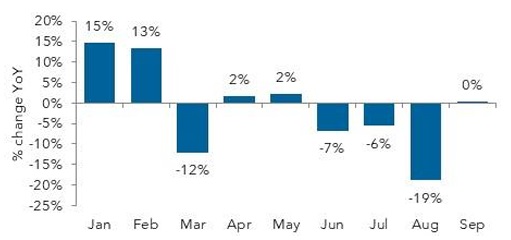
Short-haul
After a solid start to 2023, shorthaul fares inflation was weak from March to September. Ticket prices were lower, year-over-year, in most months, and hardly rose in others.
Over the nine months, airfares eased on average by 2% and were essentially flat in September.
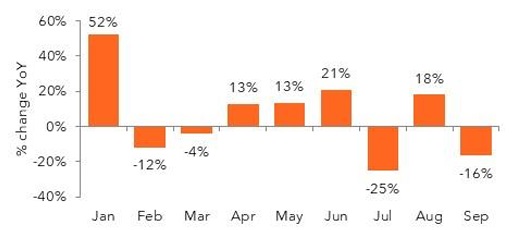
Long-haul
During the first three-quarters, long-haul fares rose 4%.
Year-over-year comparisons have varied. While a trend of increased fares appeared to be emerging, this was interrupted by decreases in July and September. These were caused by fare spikes in the same months in 2022. In 2023, since May, ATPs varied little between the months. This suggests fares should continue trending around 15% higher.
Outlook

Pre-pandemic, airfares were already falling. The pace of decrease deepened to more than 30% in 2020. After two years of recovering prices, with a particularly strong increase recorded in 2022, by 2023, fares had moved 20% higher than in 2019.
After a year of consolidation in 2023, IATA expects another steep rise in 2024, with airfares likely to jump by 28%.
Source: BCD transactional data and IATA forecasts
Namibia
Recovery in airline capacity
Summary
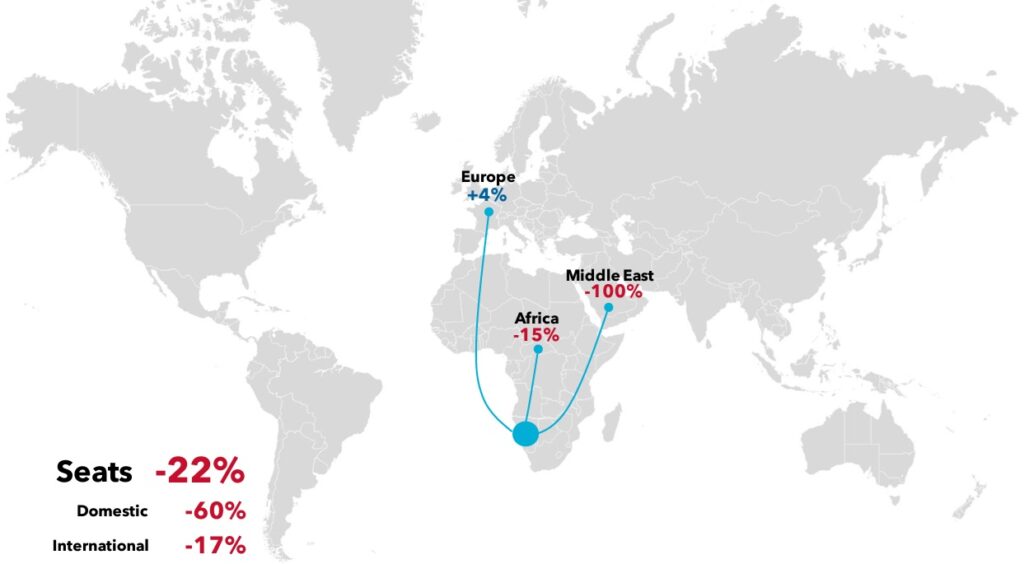
Domestic flights previously accounted for 12% of capacity in the Namibian market, and so the 60% shortfall has had a material impact on total seats, which are still 22% from recovery.
International capacity is 17% below pre-pandemic levels, with service to the Middle East (Qatar) yet to be restored. European capacity has expanded by 4%, with extra seats to Germany, the sole market served.
Namibia is directly linked to seven other African countries. While regional capacity is down by 15%, this is largely due to 24% fewer seats to South Africa. Air Namibia and Comair have collapsed, and the restructuring of SAA has seen its services largely replaced by Airlink, which operates smaller aircraft.
Elsewhere in Africa, seats to Ethiopia have increased by 35%. Zimbabwean capacity is up by almost 200%, but it is available only on a Victoria Falls tag beyond Discover Airlines’ Frankfurt-Windhoek service.
Source: BCD analysis of OAG data, January 2024 v 2019, non-stop flights only
Namibia
Average ticket prices in 2023
Short-haul
With the exception of April and June, short-haul ticket prices increased throughout the first nine months of 2023. Over the period, fares were 18% higher.
During the third quarter, inflation strengthened, with fares typically one quarter higher than in 2022.
Long-haul
Long-haul fares started 2023 off with some strong increases. But from April, ticket prices were lower year-over-year in almost all months through September.
The strong start meant a 9% rise across the nine months, but fare decreases now seem established. For the final two months, fares fell around 10%.
Outlook
The absence of any significant variation across the years means these figures should be treated with some caution. It suggests a lack of access, on IATA’s part, to accurate numbers for the Namibian market.
In the context of what may have happened between 2019 and 2023, IATA expects airfares inflation to stabilize in 2024 and 2025.
Source: BCD transactional data and IATA forecasts
Nigeria
Recovery in airline capacity
Summary
Domestic flights account for almost 60% of capacity in the Nigerian market. Seats are just 6% from recovery.
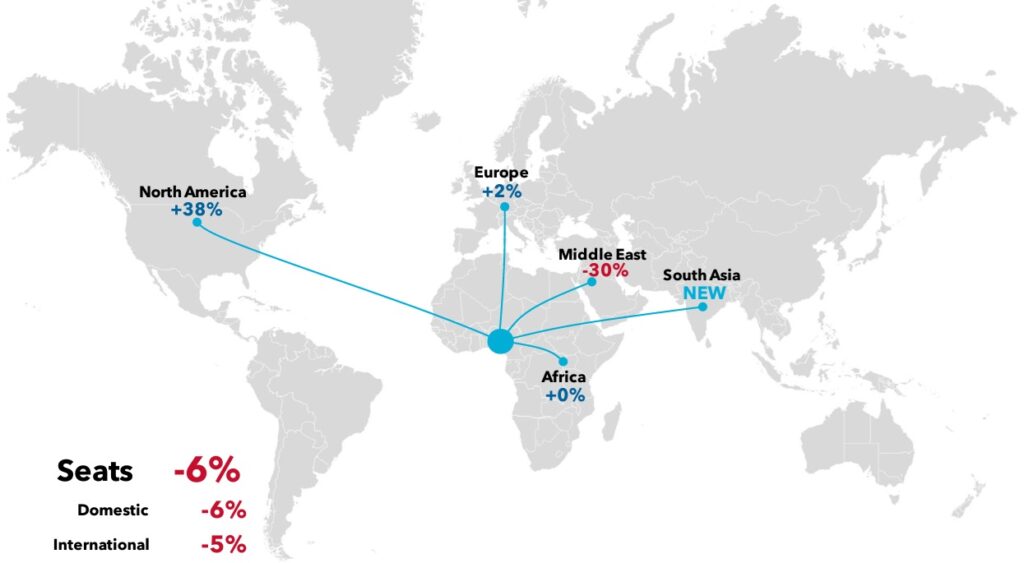
International capacity is just 5% short of its pre-pandemic level. Capacity to the Middle East is still down by 30%, with airlines not yet resuming services to the U.A.E.
On North American routes, capacity is already 38% higher than pre-pandemic. Delta Air Lines has lifted Atlanta services from four to seven per week, but it’s dropped the tag to Houston. It has also not resumed thrice-weekly services to JFK. But travelers have gained access to Washington DC, with United Airlines starting thrice-weekly flights.
With the recent start of thrice-weekly flights from Lagos to Mumbai, Nigerian carrier Air Peace has established direct air links from Nigeria to South Asia.
Source: BCD analysis of OAG data, January 2024 v 2020, non-stop flights only
Nigeria
Average ticket prices in 2023
Short-haul
During the first four months of 2023, air fares rose sharply, despite little change in demand.
While fares inflation eased to more reasonable levels from May, it jumped back up to around 36% in August and September.
Over the nine months, short-haul ticket prices were 56% above 2022 levels.
Long-haul
After strong inflation in ticket prices in February-May, fares were much weaker year-over-year over the next four months.
Pricing became more settled in 2023, with less variation across the months, which may herald more consistent inflation across the months in 2024.
Outlook
Airfares had already fallen by 10% in 2019, before almost halving in 2020. Since then, IATA has observed three years of strengthening price increases, which should have pushed fares 31% above their pre-pandemic level by 2023.
While IATA expects airfare inflation to rapidly moderate to 7% by 2025, by this point, ticket prices could be 60% higher than in 2019.
Source: BCD transactional data and IATA forecasts
Senegal
Recovery in airline capacity
Summary
Domestic capacity has yet to return to pre-pandemic levels, but it normally accounts for just 5% of all seats.
Non-stop flights operate to four regions. Capacity to other African countries is just 5% from recovery. Seats to Algeria, Cote d’Ivoire, Ghana, Nigeria and Tunisia are still far below pre-pandemic levels, while Niger is no longer connected to Senegal.
There has been a dramatic 145% expansion of seats to North America. While Delta Air Lines has added a third weekly service to New York JFK, it’s been joined in this market by Air Senegal with two weekly flights.
The one-third rise in seats to the Middle East is due to Turkish Airlines lifting Istanbul service from five to seven weekly flights. It has also delinked the service from Nouakchott.
European capacity is 25% higher, driven by expansion to France, Italy and Spain, and the start of non-stop scheduled flights to Germany, Luxembourg and the U.K.
Source: BCD analysis of OAG data, January 2024 v 2020, non-stop flights only
Senegal
Average ticket prices in 2023
Short-haul
After some strong year-over-year increases at the start of 2023, short-haul airfares fell in most of the summer.
Rising ticket prices returned in August, with September’s fares more than a third higher than in the same month in 2022.
Long-haul
Long-haul fares were higher throughout the first nine months of 2023, averaging a 23% increase for the period.
The exact level of increase was quite erratic across the different months, with no clear pattern evident.
Outlook
Airfares may have risen by 3% in 2019. Since then, the absence of any significant variation across the years suggests these figures should be treated with some caution. IATA may have lacked the data needed to create more meaningful numbers.
Putting the exact numbers to one side, the one message to take from this chart is IATA’s expectation that airfares inflation will ease in 2024 and weaken even further in 2025.
Source: BCD transactional data and IATA forecasts
South Africa
Recovery in airline capacity
Summary
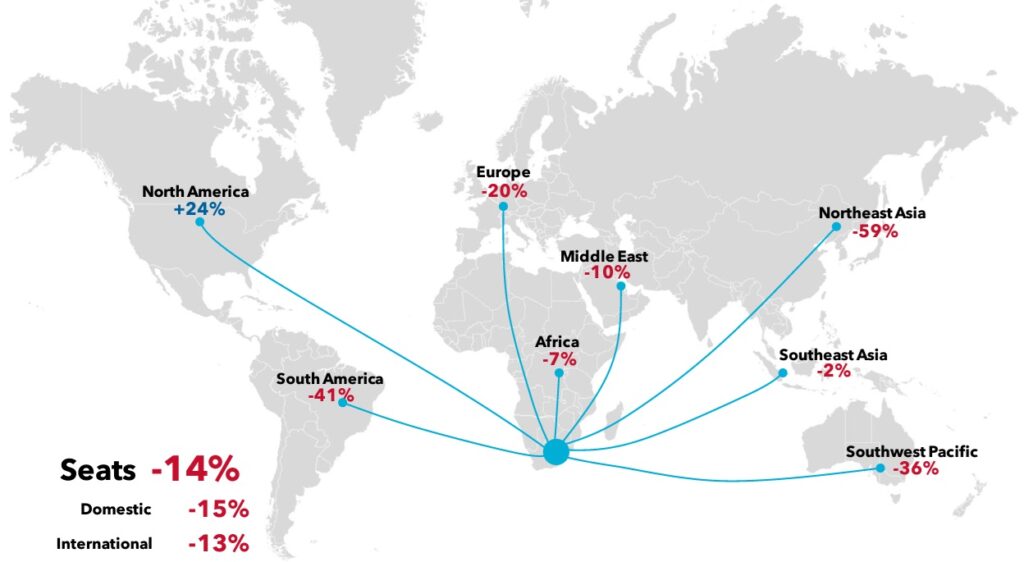
Both domestic and international airline seats are similarly short of a full recovery, averaging 14% below pre-pandemic levels.
The shortfall in international capacity ranges from just 2% to Southeast Asia up to 59% to Northeast Asia.
North America is the only region to register an expansion in capacity. While Delta has cut Johannesburg-Atlanta services from seven to three per week, it’s added a daily service from Cape Town. And United Airlines has entered the market with thrice-weekly flights from Cape Town to both Newark and Washington DC.
Outside of Africa, Europe is South Africa’s largest market. Capacity is still down by 20%. Services have yet to be restored to Austria or Italy, and capacity to Germany and the U.K. is still down by around one-fifth. Only Switzerland has seen an increase in seats, with Swiss deploying larger aircraft on its daily Johannesburg-Zurich services
Source: BCD analysis of OAG data, January 2024 v 2020, non-stop flights only
South Africa
Average ticket prices in 2023
Short-haul
After a solid start to 2023, with ticket prices rising by around 15% in the first two months, the rest of the year was characterized by falling prices.
The depth of the price decreases was showing signs of easing, with September’s fares down by 9%.
Over the first nine months, fares were 4% lower than in 2022.
Long-haul
A broadly similar pattern emerged for long-haul fares, with a solid start followed by a much weaker situation.
From May, fare movements ranged by -5% and +5%.
During the first three-quarters of 2023, fares rose on average by 6% year-over-year.
Outlook
According to IATA, airfares fell by 7% in 2019. As the pandemic hit, the market endured two more years of lower fares. However, a virtual doubling in ticket prices in 2022 saw them returned to their pre-pandemic level.
With constrained capacity, following the demise of Comair and a much reduced South African Airways, fares should increase by 10% in both 2023 and 2024.
Source: BCD transactional data and IATA forecasts
Sudan
Recovery in airline capacity
Summary
Sudan is in the grip of a civil war, which started in April 2023 and has continued into 2024.
Flights continue to appear in the schedule but are vulnerable to airspace closures. Domestic capacity has been heavily curtailed, standing at just 3% of its pre-pandemic level.
International capacity is still down by more than three-quarters. In Africa, connections (much-reduced) continue to Egypt, Eritrea, Ethiopia and South Sudan. Limited operations also continue to the Middle East, with capacity available to Oman, Qatar, Saudi Arabia, Turkey and the U.A.E.
Source: BCD analysis of OAG data, January 2024 v 2020, non-stop flights only
Sudan
Average ticket prices in 2023
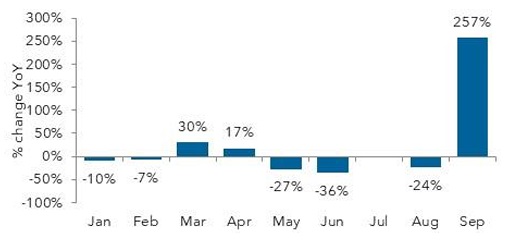
Short-haul
Fare movements in 2023 were influenced by April’s outbreak of armed conflict in Sudan, which led to airspace closures.
The civil war has continued into 2024 and will most likely lead to more spikes in airfares, as seen in September’s 257% jump.
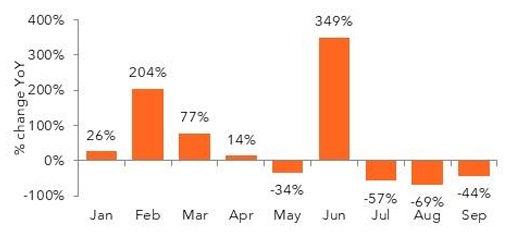
Long-haul
The long-haul segment has also been impacted by erratic yearover-year movements in prices.
From February’s 204% increase, fares were falling by 34% in May, only to be followed by a 349% surge in June, when the civil conflict intensified in Sudan’s capital, Khartoum.
During the third quarter, the trend of rapidly falling airfares appears to have been re-established.
Outlook
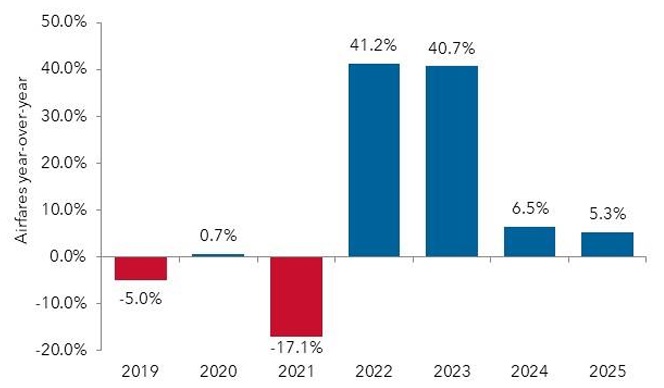
It was not until 2021 that the pandemic appeared to have a material impact on airfares in the Sudanese market. However, by 2023, two years of increases above 40% propelled airfares two-thirds higher than in 2019.
IATA expects more modest increases of 5-7% over the next two years, although these may be tempered by geopolitical developments in the country.
Source: BCD transactional data and IATA forecasts
Tanzania
Recovery in airline capacity
Summary
Airline seats for both domestic and international travel are already far above their pre-pandemic levels.
Domestic seats are more than a quarter higher, driven by an expansion of capacity on minor routes not featuring either Dar Es Salaam or Kilimanjaro in their itineraries.
The strongest international expansion has been to markets in South Asia and the Middle East. By increasing frequency of its services from Dar Es Salaam to Mumbai, Air Tanzania has lifted India seats by 17%.
In the Middle East, capacity to Oman is up by 11%, Qatar by 30%, Turkey by 6% and the U.A.E. by 12%. And Tanzania is now connected to Saudi Arabia, with Saudia operating four weekly flights to Jeddah from Dar Es Salaam.

Source: BCD analysis of OAG data, January 2024 v 2020, non-stop flights only
Tanzania
Average ticket prices in 2023
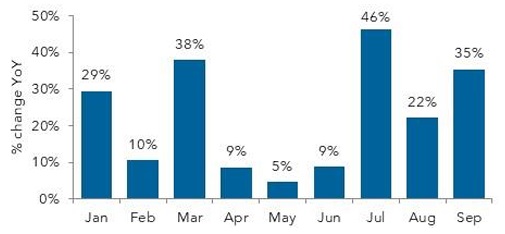
Short-haul
Despite a softening of inflation in the second quarter, during the first nine months of 2023, Tanzanian airfares rose by 23%.
Pricing pressures intensified in the third quarter, when fares averaged one-third higher year-over-year.
Long-haul
Year-over-year inflation in long-haul airfares was mixed in 2023. Strong rises were recorded in January and April, but three months of lower airfares followed.
The third quarter saw more sustained airfares inflation.
Outlook
Fares were decreasing before the onset of the pandemic, which pushed them 45% lower in 2020. IATA predicts an end to rising prices, which had pushed airfares in 2023 12% above their 2019 levels.
For 2024 and 2025, IATA currently expects very slight deflation in airfares.
Source: BCD transactional data and IATA forecasts
Tunisia
Recovery in airline capacity
Summary
While international seats are 12% above pre-pandemic levels, domestic capacity is still 27% from recovery.
Expansion has been strongest to North America, with 44% more seats offered to Canada. Tunisair has increased flights to Montreal from one to three per week.
Capacity to Europe, Tunisia’s largest destination market, is up by a quarter. U.K. capacity is up by 157%. This is largely the result of easyJet’s entry, with 11 weekly flights to Enfidha, spread across Bristol, Gatwick, Luton and Manchester departures.
Capacity to Switzerland is also up by 150%, with Nouvelair starting flights to Basel and Geneva from Tunis, and easyJet adding twice-weekly Geneva-Edfidhaflights.
Seats from Belgium, France and Germany are also more than a quarter higher.
Source: BCD analysis of OAG data, January 2024 v 2020, non-stop flights only
Tunisia
Average ticket prices in 2023
Short-haul
Apart from the month of April, short-haul fares fell throughout the first three quarters of 2023, resulting in an average decrease of 21% during the period.
The level of decrease has varied considerably across the months, with no clear trend emerging.
Long-haul
After a strong start to the year, long-haul fares fell almost continually from April until September.
As a result, over the first nine months of the year, fares were 4% lower than in 2022.
Outlook
After 2020’s initial fall, airfares fell sharply in 2021, but they rebounded even more rapidly in 2022.
A modest 3.3% rise in 2023 brought fares almost back to their pre-pandemic levels. IATA expects recovery to be achieved in 2024, although it maintains a view of very low fares inflation through 2025.
Source: BCD transactional data and IATA forecasts
Uganda
Recovery in airline capacity
Summary
While domestic capacity is 40% above its pre-pandemic level, it accounts for just 4% of total seats. International seats are just 2% from recovery.
This rebound largely reflects a doubling in capacity to the Middle East. Qatar Airways’ introduction of daily Doha-Entebbe flights has opened Qatar as a destination. There are also almost 80% more seats to the U.A.E. Although Emirates has reduced frequency, Flydubai has increased Dubai flights from four to ten per week, and Uganda Airlines has started four weekly flights. Air Arabia has also entered the market, with a daily Sharjah service.
South Asia is a newly-connected market, with Uganda Airlines offering three-weekly Entebbe-Mumbi flights and RwandAir flying Kigali-Mumbai twice-weekly via Entebbe.
Africa is trailing the other regions, with capacity still 30% down, with notable shortfalls to C.A.R., DR Congo, Ethiopia, Kenya, Rwanda and Tanzania.
Source: BCD analysis of OAG data, January 2024 v 2020, non-stop flights only
Uganda
Average ticket prices in 2023
Short-haul
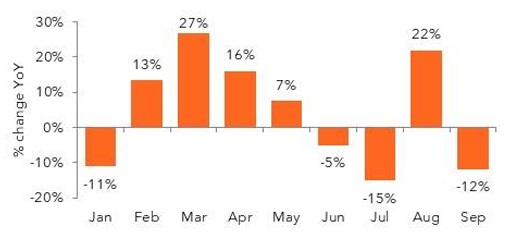
During the first nine months of 2023, short-haul fares in the Ugandan market averaged a 26% year-over-year rise.
After a weak performance in April and May, upward pressure on ticket prices seems to have been restored from June, with fares typically up by around a quarter.
Long-haul
Long-haul fares averaged a 4% year-over-year rise during the first nine months of 2023.
The market saw much stronger fares inflation during the first five months. However, apart from the 22% spike recorded in August, fares have generally been falling since June, dropping by 12% in September.
Outlook
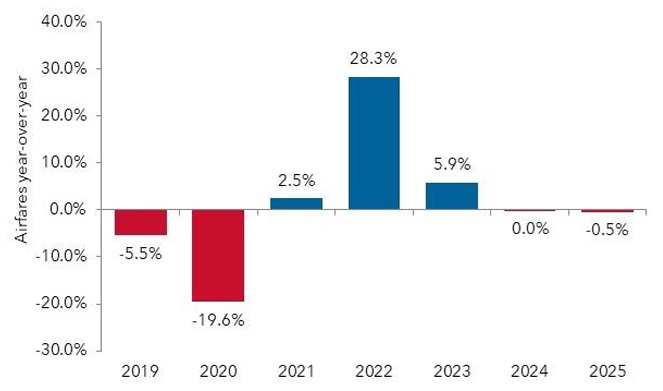
Fares dipped by close to 6% in 2019 and fell by a further fifth in 2020. After a slow start, a recovery got under way in 2022, when prices rose by 28%. Airfares inflation moderated in 2023, but ticket prices advanced to 12% higher than in 2019.
IATA largely expects fares to remain at this level through 2025.
Source: BCD transactional data and IATA forecasts