
Strong Demand, Slower Growth: Despite a slight slowdown in growth, robust passenger demand is projected to push airline industry revenue beyond $1 trillion in 2025.
Profitability Boost: Lower fuel prices are anticipated to improve profitability, with global net profits expected to reach $37 billion, helping to offset rising labor costs.
Regional Recovery: The pace of recovery varies globally, with North America and the Middle East currently leading the way.
Safety Performance: While 2024 saw a slight dip in safety records compared to the exceptional levels of 2023, the industry remains focused on safety.
Global airline industry outlook
Outlook for 2025
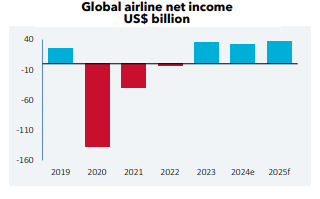
The International Air Transport Association (IATA) expects total airline industry revenue to surpass $1 trillion for the first time in 2025, although the 4.4% year-over-year (YoY) rise will represent a slowdown from 2024’s estimated 6.2% growth. Having remained strong in 2024, passenger traffic will continue to grow in 2025, albeit at a slower pace, as all regions record demand above pre-pandemic levels. This will support a 4.0% rise in global airline passenger revenue to $705 billion.
Having fallen by almost 5% in 2024, it seems likely that the decline in average ticket prices will slow to less than 3% in 2025. But with operating expenses set to rise at a slightly slower pace than total revenue, airlines may expect a small rise in both margin and profit. While struggling with rising labor costs, which are forecast to be 8% higher in 2025, an anticipated 5% decrease in fuel costs will provide some relief to airline bottom lines. IATA currently expects YoY growth of 16% in 2025 to deliver a third consecutive year of global net profits exceeding $30 billion.
Between 2020 and 2022, the world’s airlines had accumulated almost $182 billion in net losses; they’re estimated to have delivered combined profits of almost $67 billion for the 2023-2024 period. It’s clear they still have a long way to go to fully offset the damage done by the pandemic, but 2025’s predicted $37 billion net profit will be further real progress in restoring airline finances.
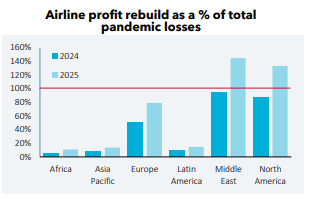
Airlines in some regions are making better progress than others elsewhere. So far, only those in the Middle East and North America have accumulated sufficient profits to come close to offsetting past losses. IATA believes 2025 should see both regions back in credit. Middle Eastern airlines should lead the way, with profits accumulated over the 2023-2025 period 45% than sustained pandemic losses. At this point, European airlines should have generated sufficient profits to offset 80% of their losses. But airlines in the rest of the world will still have a long way to go to fully repair their finances.
Regional Prospects for 2025
Africa – high costs, a low propensity to travel, and constraints on expansion will limit profit improvement among the region’s airlines, despite sustained demand.
Europe – with 2024’s peak aircraft groundings largely behind them, Europe’s low-cost carriers will expand, driving the region’s healthy 7% growth in traffic forecasted for 2025.
Middle East – as they pursue some ambitious growth targets, expansion by both full-service and low-cost carriers in 2025 should ensure they fail to build on the previous year’s rise in yield.
Asia Pacific – slowing, but still-strong traffic growth and marginally higher load factors should lead to a modest rise in profitability in 2025.
Latin America – the conclusion of restructuring programs at some major airlines and more favorable exchange rate movements should result in higher profits in 2025.
North America – operating margins should see only a modest rise from 3.6% to 4.2%, as low-cost carriers compete more with full-service airlines for higher margin revenue streams.
Airline Safety in 2024
Only a slight retreat from 2023’s exceptional performance
According to data released by the International Air Transport Association (IATA), the global airline sector delivered another year of strong overall performance in respect of safety, with improvements compared to the five-year average for a number of key metrics. But 2024 was unable to match 2023’s exceptional performance.
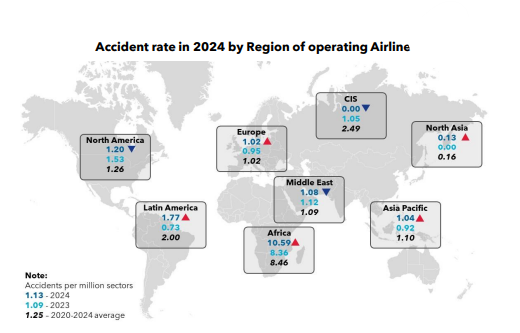
The all-accident rate of 1.13 incidents per million flights (one accident every 880,000 flights) was better than the five-year average of 1.25, but it was slightly worse than 2023’s 1.09 (one accident every 917,000 flights).
Among the 40.6 million flights conducted in 2024, there were seven fatal accidents, which was better than 2023’s single fatal event and above the five-year average of five accidents per year.
The number of on-board fatalities jumped from 72 in 2023 to 244 last year. This was also 69% above the five-year average of 144. While the fatality risk doubled year-over-year, it remained incredibly low at 0.06 and below the five-year average of 0.11.
As Willie Walsh, IATA’s Director General notes: “Even with recent high profile aviation accidents, it is important to remember that accidents are extremely rare.”
Between 2011 and 2015, there was on average one accident every 476,000 flights. The figure for 2020-2024 was much-improved at one accident every 810,000 flights. In less than 10 years, the chances of being involved in an incident have fallen by 70%.
Year-over-year (YoY), accident rates in 2024 deteriorated in five of the eight regions covered by IATA. For a sixth consecutive year, Africa posted the weakest performance, with its airlines suffering 10.59 accidents per million flights, 27% higher YoY. At 1.42%, Latin American airlines posted the fastest rise in accident rate, although at 1.77, it was still below the five-year average.
Accident rates improved in three regions in 2024, with the CIS recording no accidents. Elsewhere, the Middle East and North America posted improvements in their accident rates of 4% and 22%, respectively.
Key safety insights
- Rising Conflict Zone Risks: two aircraft were downed in conflict zones in 2024: one in Kazakhstan with 38 fatalities, and one in Sudan with five fatalities.
- Most common accidents: tail strikes and runway excursions were the most frequently reported incidents in 2024.
- Airlines on the registry of IOSA (IATA Operational Safety Audit) had an accident rate of 0.92 per million flights, compared to 1.70 recorded by non-IOSA airlines.
U.S. airline performance in 2024
Yields were an important differentiator in 2024 performance
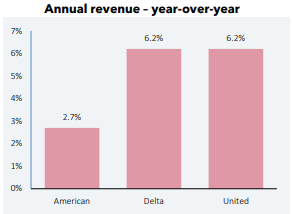
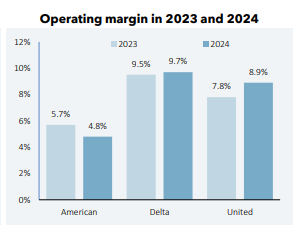
During 2024, both Delta Air Lines and United Airlines lifted total annual revenue by 6.2%. American Airlines, the third of the U.S. market’s big three network carriers, trailed its rivals with growth of just 2.7%. The differences didn’t end there, though — both Delta and United also posted improved profitability — most notably United, which lifted its operating margin from 7.8% to 8.9% for the year — American saw its margin dip from 5.7% in 2023 to 4.8%. Not only did American’s margin fall; it was much lower than its rivals.
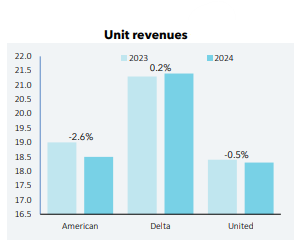
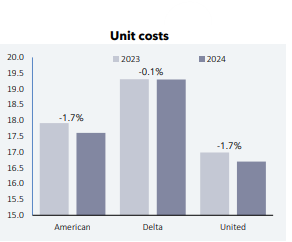
The explanation for American’s performance seems simple enough. Its unit revenues or yields (revenue per available seat mile or RASM) fell by a faster 2.6% than the 1.7% easing in its unit costs (cost per available seat mile or CASM). United also recorded a 1.7% dip in its CASM, but with its yields falling by just 0.5%, this translated into the boost in operating margin that American missed out on.
With the year-over-year movement in Delta’s yields and costs almost the same, at -0.1% and +0.2% respectively, the airline delivered only a slight rise in its operating margin. Its yield performance proved to be the main differentiator between American Airlines and its two competitors.
But this doesn’t mean the cost side of the equation should be ignored. A closer examination reveals an interesting continuation of the main cost challenge facing U.S. airlines: labor.
Fuel used to be airlines’ main cost problem. But, having fallen by 17-18% in 2023, the past 12 months recorded a further drop in fuel unit costs of 10-13% in 2024. That’s great news for the airlines, given that fuel normally accounts for more than one-fifth of their operating costs. But at the same time, 2023’s 5-10% rise in airline labor costs was followed by another 4-6% increase in 2024. Labor is now U.S. airlines’ biggest cost line, accounting for around one-third of total operating costs. As they continue to grapple with elevated labor costs, airlines should at least be able to take some comfort from recent forecasts for the 9% fall in oil prices currently forecasted for 2025.
Rail travel: traveler survey
Business travelers share their experiences and behaviors on rail journeys
In this new survey we explored the topic of traveling by rail for business. We looked at traveler behavior and the challenges they face when traveling by rail. Our study also included an exploration of travelers’ satisfaction with their companies’ rail policy and suppliers. The results are based on an online survey we conducted among 681 business travelers located in Europe and Asia Pacific, who took a train for business purposes at least once in the past 12 months. The survey was conducted between January 27 and February 14, 2025.
Our findings, at a glance
Rail travel: overview
Type of trip: Six out of 10 business travelers take rail journeys within their own country.
Type of supplier: 94% use traditional rail companies. Of these, nearly two-thirds rely solely on traditional operators, while the rest also use low-cost providers.
Type of service: Regular and high-speed train services are equally popular, with around three out of 10 travelers using one or the other exclusively, leaving 42% using both.
Class of rail: Half travel in economy class, while a quarter of travelers opt for business class.
Reasons for selection
We discovered large regional differences between European and Asian travelers when choosing between rail and air travel. On routes where both are viable options, three-quarters of European respondents select rail, if the cost and travel time are similar. In Asia, less than half say the same.
The reasons for choosing rail vary too. Convenience and easy access to train stations are among the top-two factors for travelers from both regions. However, while the possibility to work on the road is important to half of European travelers, only 18% of Asian respondents concur.
In Europe, sustainability matters to nearly four out of 10 travelers (just 12% in Asia), while lower cost influences a third of Asian travelers (16% in Europe). Traveler attitudes to speed, safety and a lack of alternatives also differ by region.
Booking and paying for rail
Six out of ten business travelers book train tickets on rail company websites, while a third use their employer’s online booking tool to book rail travel.
Corporate credit card is the most popular payment method: Six out of 10 use it to pay for train tickets. This is followed by personal card, the option for one-third of respondents.
Sustainability
Two business travelers out of five never or rarely take into account environmental considerations when deciding to use rail over air. Meanwhile, around one out of five often do so.
Find out more
We’ve highlighted just some of the key findings from our rail travel survey.
You can find out much more detail in the full report that we’ll be publishing soon.


Share your thoughts
Do you have any questions or comments regarding this report? Please email Mike Eggleton to share your thoughts.