We read them, from childhood nursery rhymes to epic books. We watch them in the form of movies. And we tell them when we say, “You’ll never believe what happened today!”
We’re all about stories.
Yet for a long time, stories had no place in business. Instead, the focus was on data, data and more data. Here’s the catch—when you have data without context, you just have just data, and that can be overwhelming.
What if you could tell a compelling story with your travel program data—a story that grabs the attention of your stakeholders?
You can. Business intelligence (BI) helps you tell highly relevant, persuasive stories, personalized and delivered in easy-to-understand ways. Telling data stories helps you present your ideas better and more quickly.
Here are three things to remember when creating data stories:
- Make sure each element has a role in your story. Think about a story you know well. It likely has many elements, like characters, props and settings–and they’re all there for a reason. With business intelligence, it’s the same. You have a lot of potential characters, props and settings, in the form of data points. Use them only if they play an important role in your story.
- Tie the elements of your story together. Think again about that story you know so well. You can recite it because someone wrote the storyline. The same is true for your data. Be the author of your data story. Use your data points as characters, and write the storyline for your audience.
- Tailor your story to your audience. You might use your data to create stories for your manager, your board or your travelers. But one single story won’t work for three very different audiences. Each needs to hear what’s relevant to them.
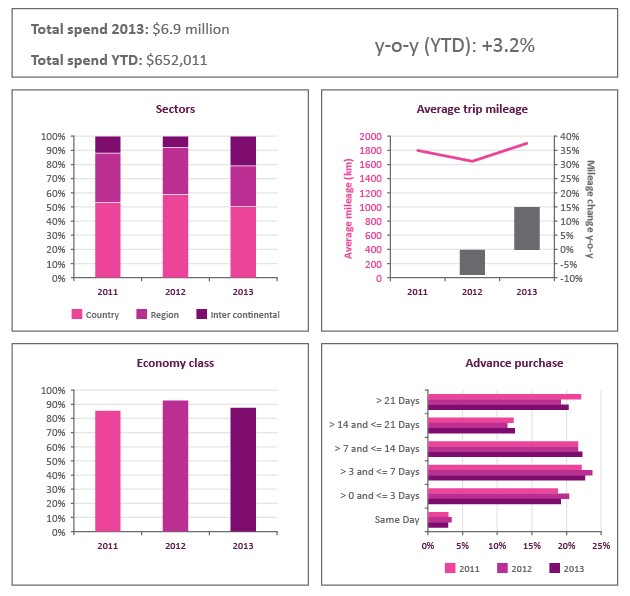
BCD Travel’s Intelligence & Analytics helps you create a story that presents your travel program in a way that’s not only easy to understand, but easy to act on. For instance, let’s say your year-over-year spend shows an increase of 3.2%. That may be an interesting number, but it’s just a number if there’s no context. You need to gather more information—more characters—to tell a story. Some you’ll want to consider may include:
- Ticket volume
- Average ticket price
- Trip distance
- Cabin class
- Domestic/international ratio
- Advance purchase behavior
Once you know if these play a role in your year-over-year spend increase, you can determine whether and how to use them. Tie your data points together to tell the story, draw the conclusion and recommend an action. Then present it.
Telling data stories means your stakeholders can understand your travel program data quicker, digest it more fully and make decisions with greater confidence. And that, in turn, means you can elevate your—and your travel program’s—contribution to your organization.
![]() We’ll offer more tips on using business intelligence in future editions. Meanwhile, download Business Intelligence in Travel and talk to your account manager about how BCD Travel can help you transform data into insights and actions.
We’ll offer more tips on using business intelligence in future editions. Meanwhile, download Business Intelligence in Travel and talk to your account manager about how BCD Travel can help you transform data into insights and actions.
Telling a data story to explain a 3.2% year-over-year increase in spend
Select and present data that shows influencing factors. Right away, you can see that regional and intercontinental trips have increased substantially. That means average mileage has gone up considerably, as well. And, likely because of the amount of intercontinental travel, more flights were booked in a premium class. Immediately the story becomes clear: Your travelers are doing their part to book in advance, they’re just taking more trips to farther destinations because that’s where your business is expanding.